
Labor Matters: Remote Work Is Still Declining, Slowly
The Census Bureau released the 2025 American Community Survey two weeks ago, and it shows that remote work is still declining. In 2025, 12.9% of workers mainly worked from home, down from 13.3% in 2024 and from a peak of 17.9% in 2021. Each year's drop has been smaller than the last, but the decline hasn't stopped. About a third of the 2025 decline came from federal workers, who are only 3.5% of all workers.
The ACS asks how people usually got to work last week, so these numbers count people who work from home most of the time. Hybrid workers who are in the office most days aren't included.
That is why the decline is easier to see here than in the Current Population Survey, the other main source on remote work. In the CPS, the share of workers doing any paid work from home barely moved in 2025, from 22.7% to 22.4%. The share of all hours worked at home fell more, from 16.0% to 15.5%. That is a decline of about 3%, close to the one in the ACS. I read this as people moving from mostly remote to hybrid.
I see three reasons for the continued decline.
First, the federal government. In January 2025 federal employees were ordered back to the office, and the share of federal workers mainly working from home, a group that includes the military, fell from 12.5% to 8.5% in one year. Among state government workers the share fell from 11.7% to 10.8%. Excluding federal workers, the national share fell 0.3 percentage points in 2025, after 0.5 in 2024.
Second, private employers are still pulling people back to the office. The share of private company employees mainly working from home fell 0.3 points in 2025, to 12.6%. That is about half the drop of the year before. But private company employees are two-thirds of all workers, so they account for about half of the national decline.
Third, I think the weak white-collar labor market matters. Workers who can't easily find another job are in a poor position to resist a return-to-office policy. I can't prove this with these data, but this is where I'm leaning.
The 2025 decline was broad. Retail, transportation and manufacturing fell too, and together they contributed more to the national decline than professional and business services. The information sector was the steepest decliner in earlier years. It fell 2.9 points in 2024 and only 0.2 in 2025, well inside the margin of error of about 0.8 points. The change in finance, insurance and real estate was also within its margin of error.
By occupation, most of the decline came from management, business, science and arts occupations, where the share fell from 19.6% to 18.7%. That is the same 0.9-point drop as the year before. Sales and office occupations edged up from 14.8% to 15.0%. Together, the two groups went from 18.1% to 17.5%.
Women work from home more than men, 14.5% against 11.4%. That gap widened during the pandemic. It was 0.8 points in 2019 and 3.1 in 2021, and it has stayed close to 3 points since. I think caregiving is the main reason. Remote work is worth more to mothers of young children than to most other workers.
I don't see a plateau yet. Information and finance were roughly flat in 2025, but private company employees as a whole and management and professional occupations are still falling. My guess is that the share settles a bit below today's level, at around 11% to 12%.
Even so, most of the pandemic shift is still in place. In 2019, 5.7% of workers mainly worked from home. Today's share is more than double that, and about 60% of the increase between 2019 and 2021 remains.
Source: U.S. Census Bureau, American Community Survey 1-year estimates, published tables, 2005-2025. No standard estimates were released for 2020. Current Population Survey figures are calendar-year averages of monthly estimates computed by Mels de Zeeuw from IPUMS CPS. October 2025 was not collected and is left out of both years.
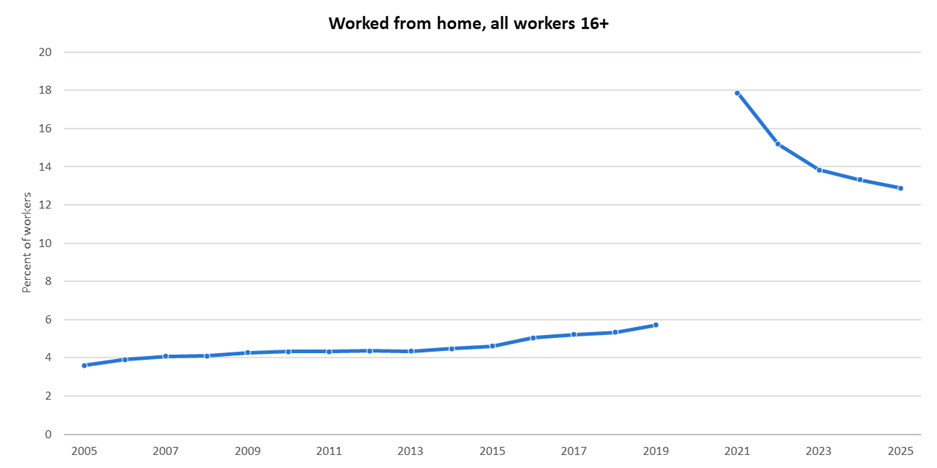
Chart 1. Share of workers who mainly worked from home, 2005-2025. The 2005 survey did not cover people in group quarters such as dorms and barracks. Source: U.S. Census Bureau, American Community Survey 1-year estimates, published tables. No standard estimates for 2020.
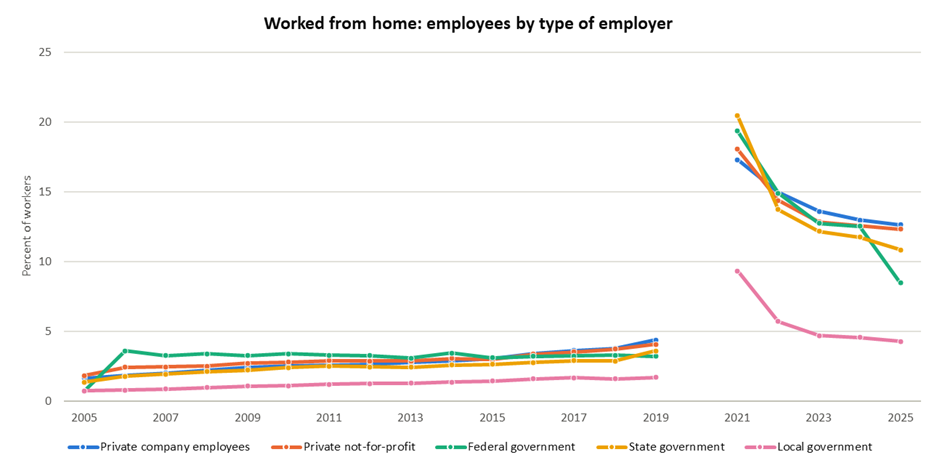
Chart 2. By type of employer. Federal government includes active-duty military; 2005 excludes group quarters. Source: U.S. Census Bureau, American Community Survey 1-year estimates, published tables. No standard estimates for 2020.
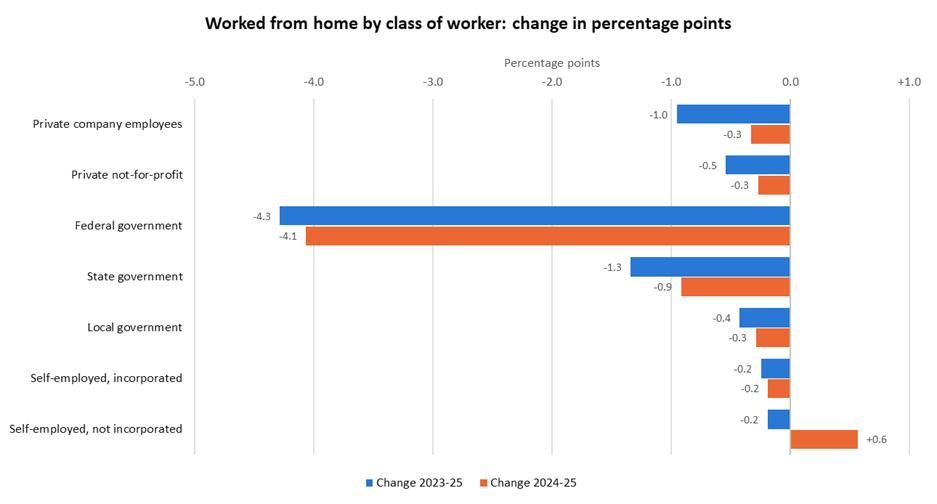
Chart 3. By type of employer: change 2023-25 and 2024-25. Changes are computed from unrounded shares. Source: U.S. Census Bureau, American Community Survey 1-year estimates, published tables.
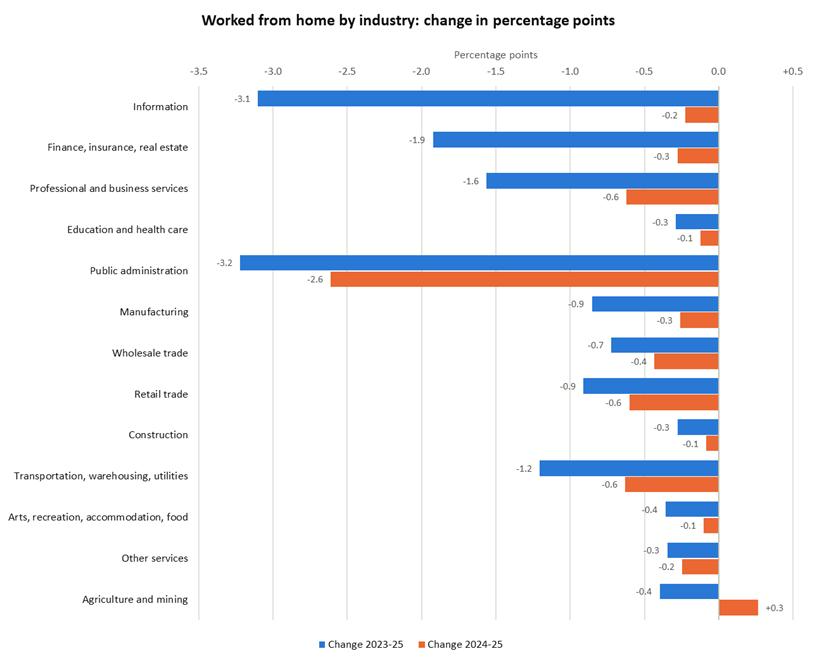
Chart 4. By industry: change 2023-25 and 2024-25. Changes are computed from unrounded shares. Source: U.S. Census Bureau, American Community Survey 1-year estimates, published tables. No standard estimates for 2020.
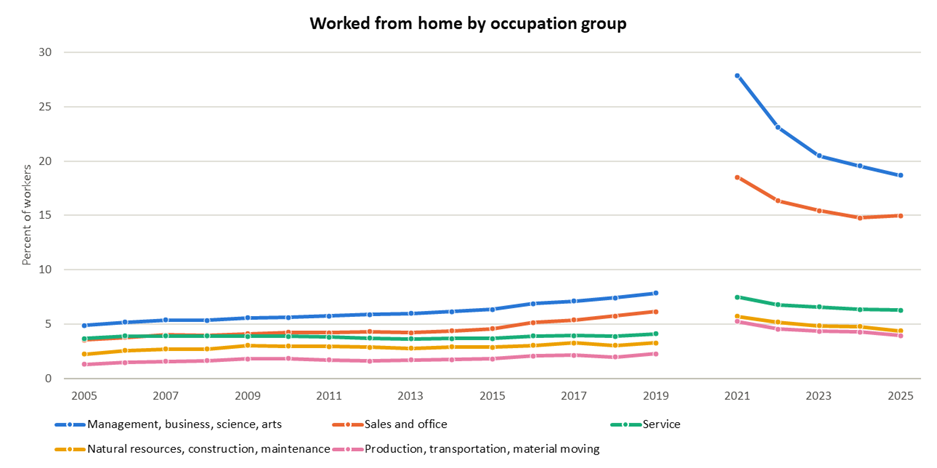
Chart 5. By occupation group. The published groups were redefined in 2010, and in 2018 new occupation codes moved about 2 million workers from sales and office to production and transportation. 2005 excludes group quarters. Source: U.S. Census Bureau, American Community Survey 1-year estimates, published tables. No standard estimates for 2020.
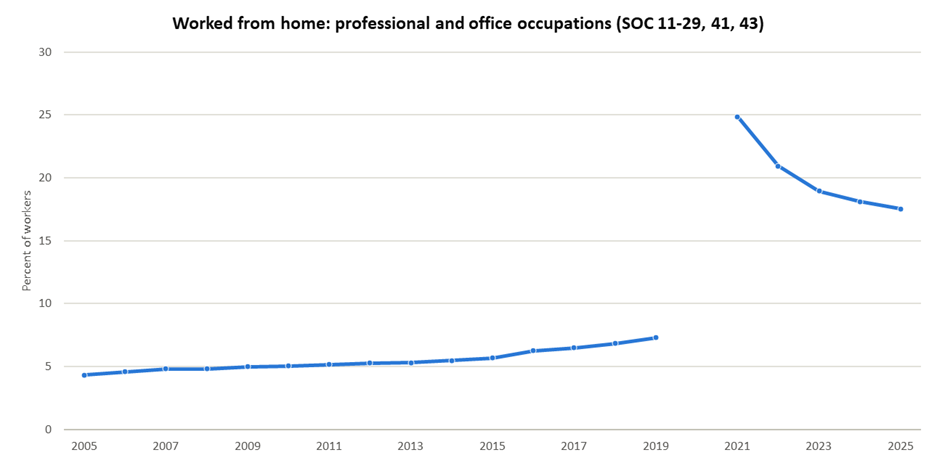
Chart 6. Professional and office occupations (SOC 11-29, 41, 43): management, business, science and arts plus sales and office. Occupation groups changed in 2010 and 2018 (see chart 5). 2005 excludes group quarters. Source: U.S. Census Bureau, American Community Survey 1-year estimates, published tables. No standard estimates for 2020.
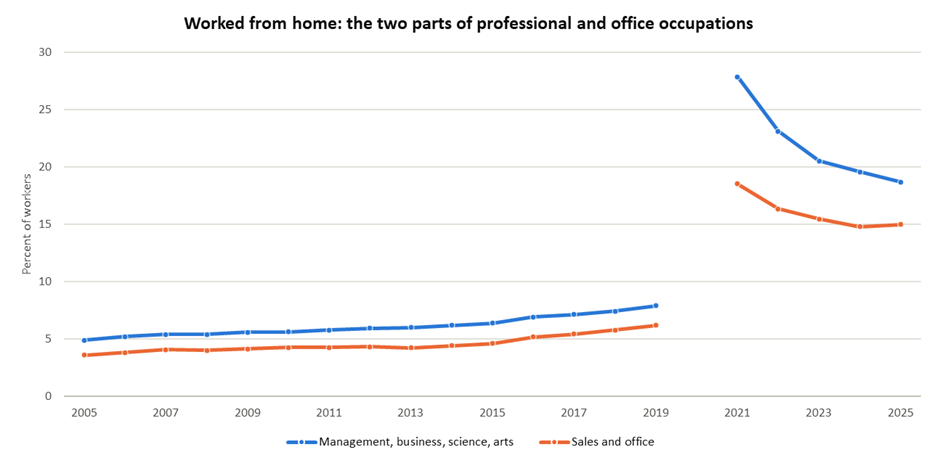
Chart 7. The two parts of professional and office occupations. Occupation groups changed in 2010 and 2018 (see chart 5). 2005 excludes group quarters. Source: U.S. Census Bureau, American Community Survey 1-year estimates, published tables. No standard estimates for 2020.
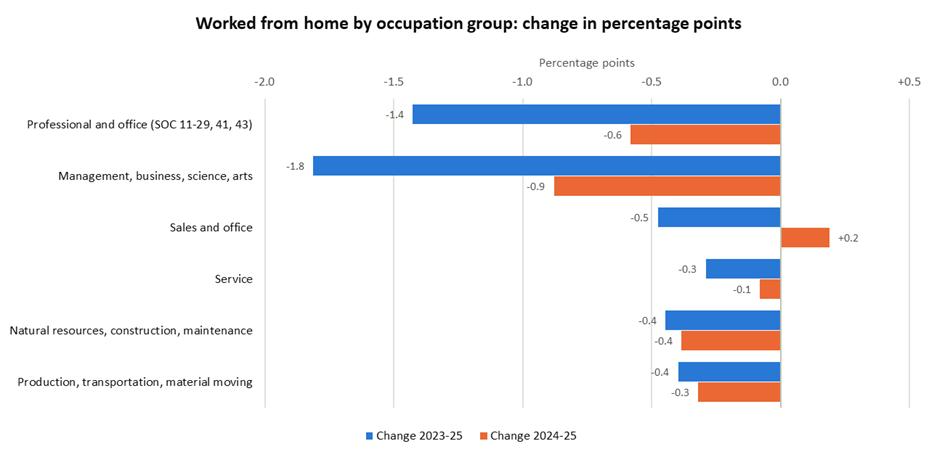
Chart 8. By occupation group: change 2023-25 and 2024-25. Changes are computed from unrounded shares. Source: U.S. Census Bureau, American Community Survey 1-year estimates, published tables. No standard estimates for 2020.
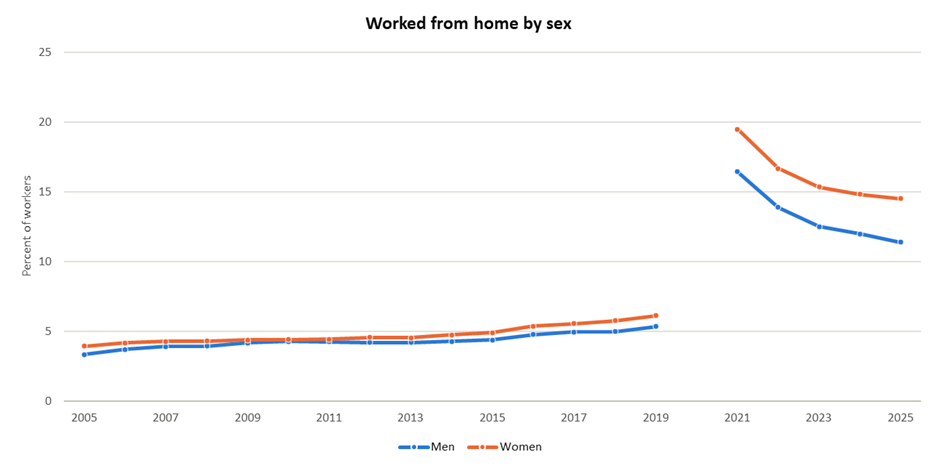
Chart 9. By sex. 2005 excludes group quarters. Source: U.S. Census Bureau, American Community Survey 1-year estimates, published tables. No standard estimates for 2020.
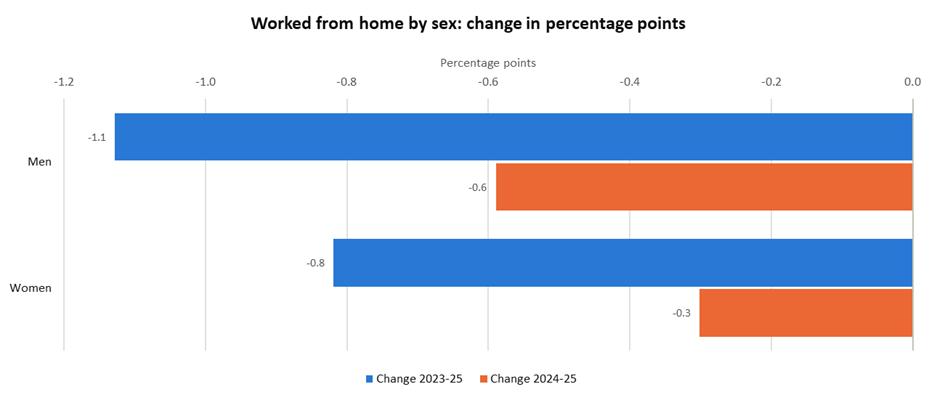
Chart 10. By sex: change 2023-25 and 2024-25. Changes are computed from unrounded shares. Source: U.S. Census Bureau, American Community Survey 1-year estimates, published tables. No standard estimates for 2020