
Labor Matters: Four Reports, One Story: The Economy Is Doing Well, and AI Is Why
Four releases in nine days: third-quarter GDP, the Employment Cost Index, the productivity report and the October jobs report. Put side by side they tell one story. The economy is growing fast, output per hour is doing most of the work, jobs are growing slowly over the year and faster lately, and unemployment is low. AI, in my view, is the main reason. It is also waiting in the background, and I expect its big effect on displacement to come in the next recession, not before.
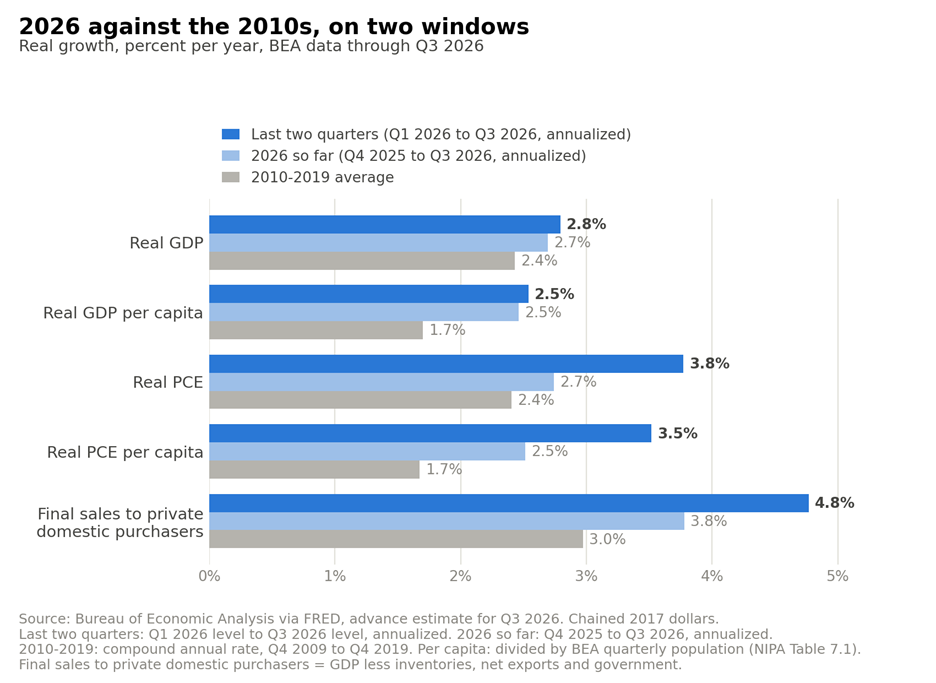
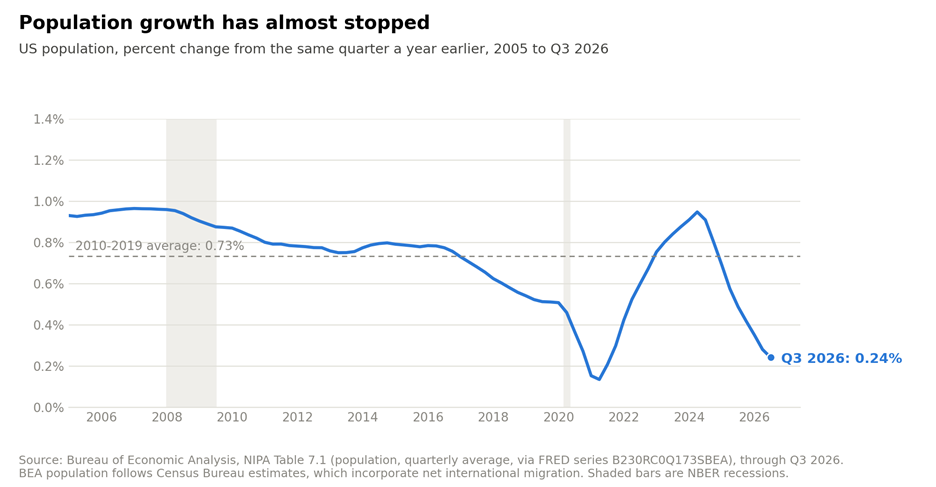
Growth. The economy is growing faster than it did in the decade before the pandemic, and faster still per person, because population growth has fallen to a third of its 2010s pace. Every quarter of 2026 has been solid and the latest two are the strongest. The weakness of 2025 came from the tariff announcements and the recession fears that followed them, and from the federal government's cuts to its own workforce and to consulting and research contracts. Those headwinds are mostly behind us. Looking forward, I expect growth of 3 percent or more. Markets read the jobs report as a reason for the Fed to raise rates in December. The case for tighter policy is demand, asset prices and financial conditions, not pay.
1. Growth is faster than in the 2010s, on both windows
2. Population growth has dropped to a quarter of a percent a year, a third of its 2010s pace
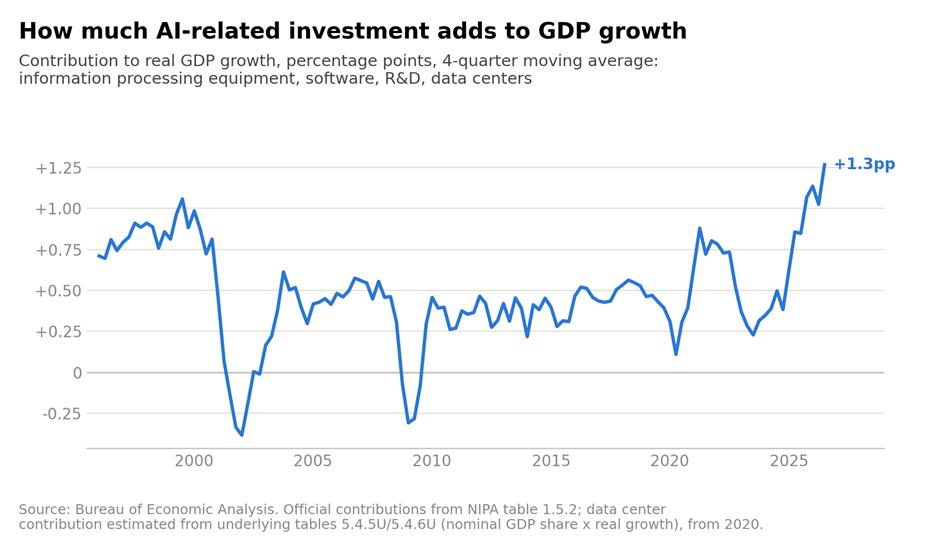
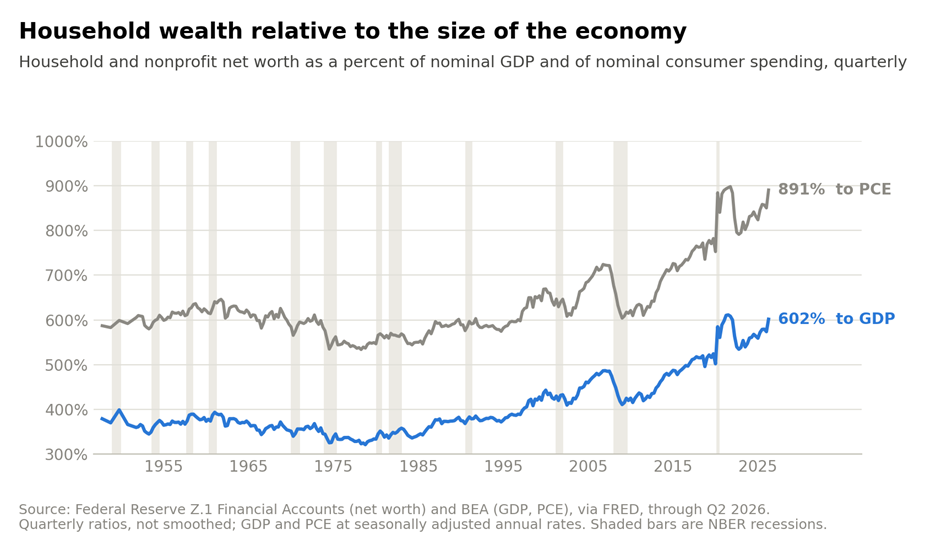
AI is the story. Over four quarters growth is 2.1 percent, because the fourth quarter of 2025 was flat during the shutdown; since then it has run 2.7 to 2.8. Investment in computing equipment, software, research and data centers added about 1.3 points of that 2.1, on a broad definition of AI-related investment and before subtracting imports, more than at the peak of the dot-com boom. That bundle was adding about half a point a year before 2023, so the increase since then is more than a third of growth. Consumption is strong too, growing faster than income, and the reason is the wealth effect: household net worth relative to the economy is above its 2000 and 2007 peaks, on an AI-driven stock market.
3. AI-related investment adds about 1.3 points to growth, by my estimate, above the dot-com peak
4. Household wealth is 602 percent of GDP, above the 2000 and 2007 peaks: the wealth effect behind consumption
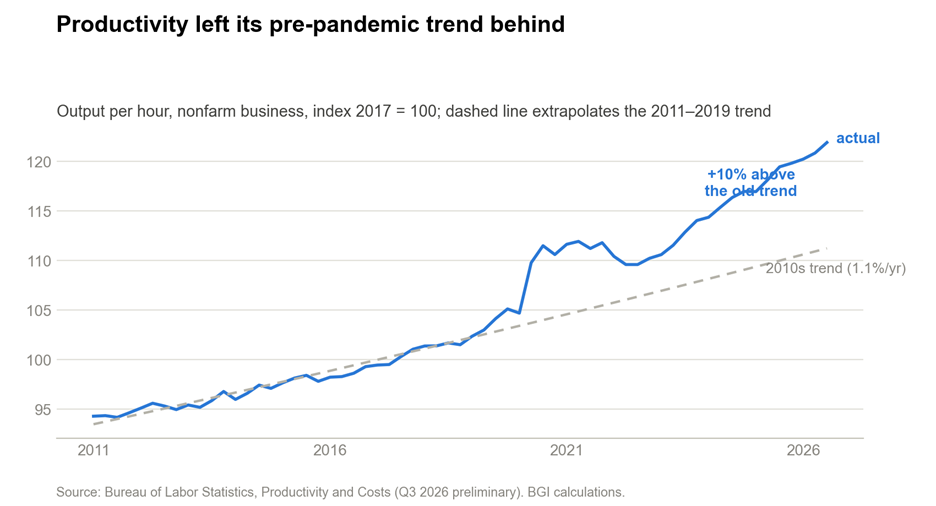
Productivity. Output per hour rose strongly again in the third quarter and now sits 10 percent above its pre-pandemic trend. Output is growing at close to 3 percent, hours at close to zero, and that has been true for about two years. The economy does not need many more workers to produce this much more.
5. Output per hour is 10 percent above its pre-pandemic trend
6. Output grows, hours do not: past four quarters versus the four before, output 2.7, productivity 2.4, hours 0.3
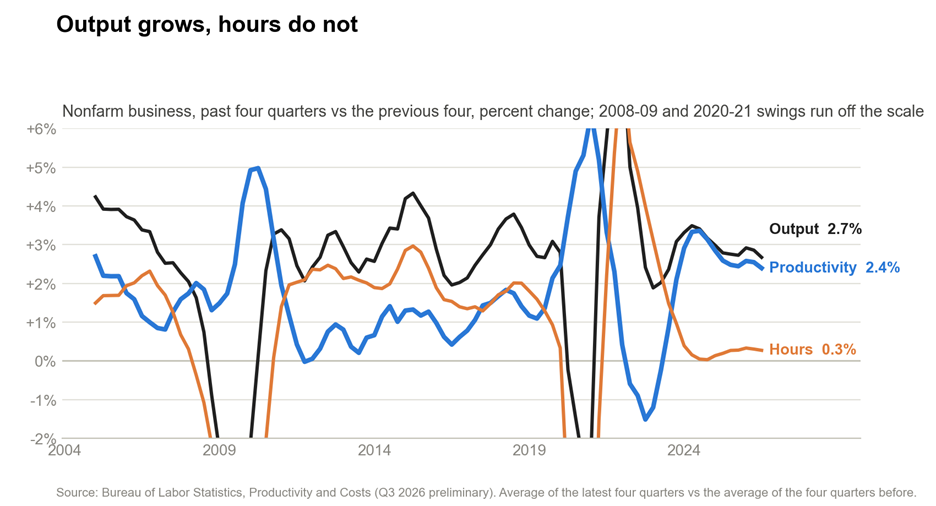
Every quarter that passes with productivity growth this high strengthens the case that the improvement is structural, and I now put a very high probability on it. The level never fell back to the old trend after the pandemic, and the gap has widened persistently since 2023, so this is not catch-up. The pace has held since 2023, longer than a cyclical burst lasts. The last time productivity ran this fast for this long was the late 1990s, and that turned out to be structural.
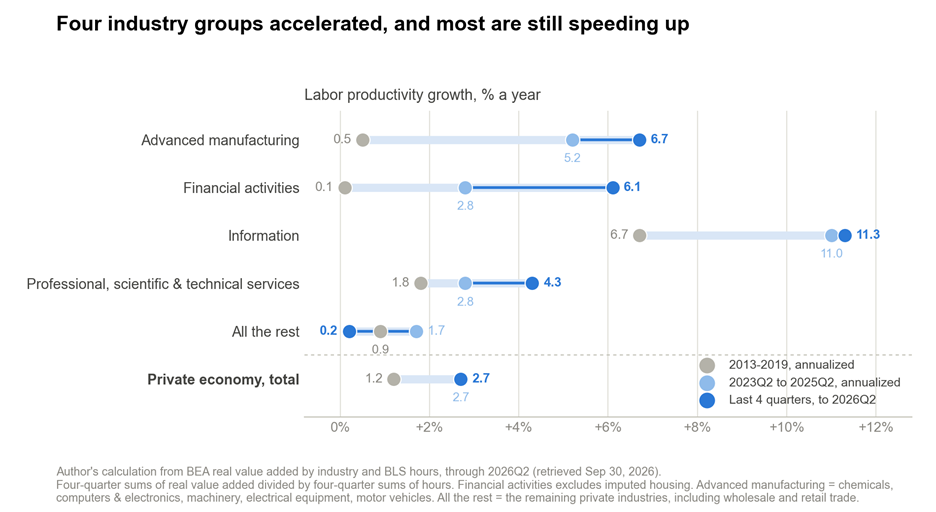
Why AI as a potential explanation? Because the gains are where the technology is. Information, finance and real estate services, professional services and advanced manufacturing are each growing output per hour several points faster than they did in the 2010s. Outside those four groups productivity growth has slowed to almost nothing, so the aggregate acceleration rests entirely on them.
7. The productivity gains are where the technology is: four industry groups accelerated, the rest did not
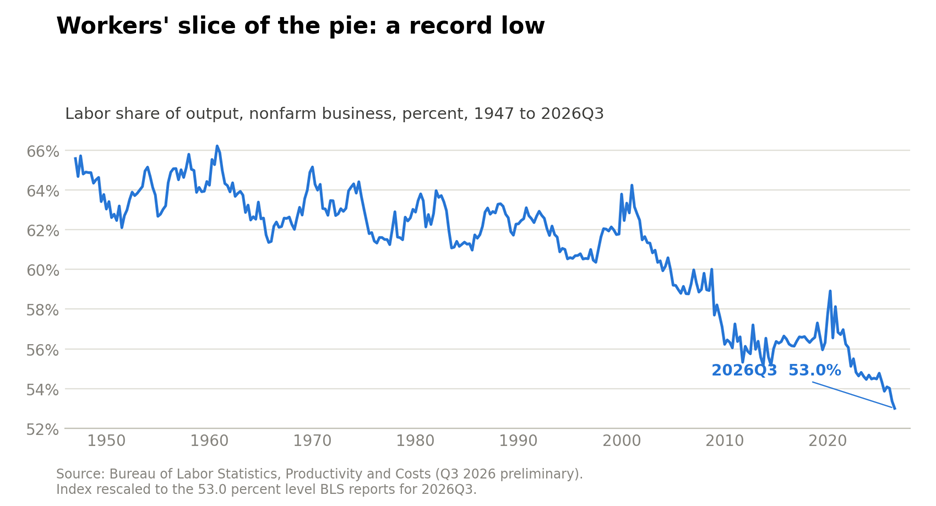
The labor share, the slice of what businesses produce that goes to workers as pay, is the lowest on current data since the series began in 1947, and it has fallen three quarters in a row. Pay per hour has risen less than output per hour, in the prices businesses sell at, and the difference has gone to profits and other capital income. Corporate profits were up sharply over the year to the second quarter.
8. Workers' share of output is the lowest since 1947
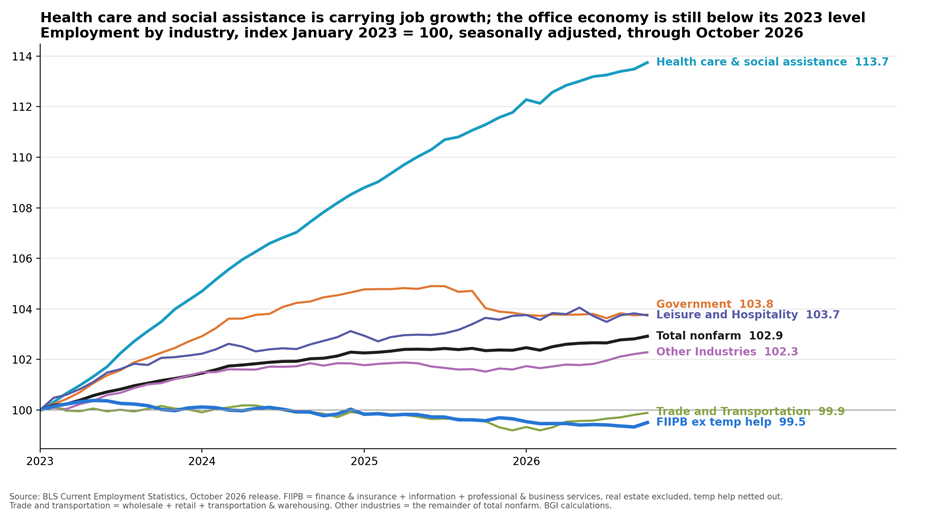
Jobs. October was a good report: a solid payroll gain, upward revisions to the two prior months, and an unemployment rate that edged down. The pickup is recent. Payrolls barely grew from May to July, as the tariff shock and the federal cuts worked through, and have averaged well over 100,000 a month since. Health care and social assistance account for close to 60 percent of the past year's job growth. October was also the best month in a long while for the office economy, with professional and business services up 70,000, and it still left FIIPB, the finance, insurance, information and professional and business services group, below its January 2023 level. I will take that apart in a separate piece.
9. Health care and social assistance is carrying job growth; FIIPB is still below its January 2023 level
The unemployment rate is low and it is not rising; it has sat in a narrow range since March. With labor supply barely growing, the economy needs only 30,000 to 40,000 jobs a month to hold it there. Payrolls have run well above that since August without a matching fall in unemployment, partly because the household survey, which the unemployment rate comes from, shows much weaker employment growth. With labor supply growing this slowly, payroll gains at the recent pace should push unemployment down, not up, and I do not expect it to rise any time soon.
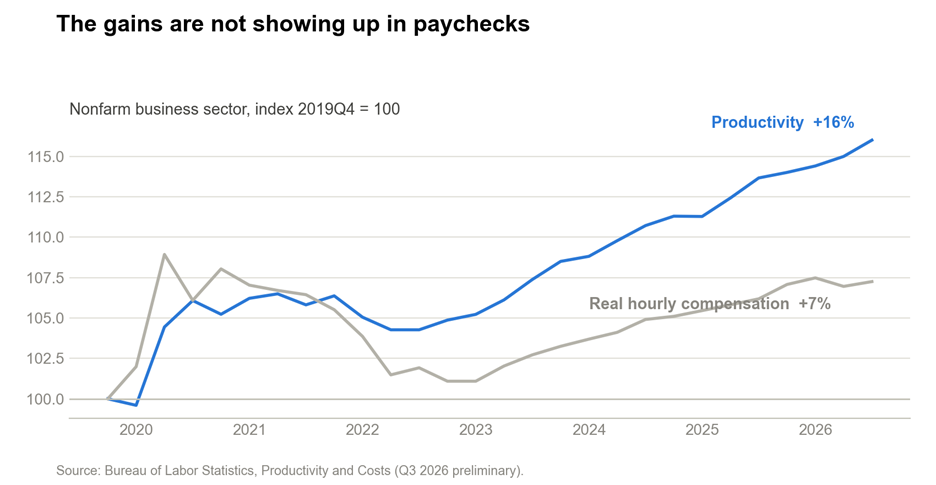
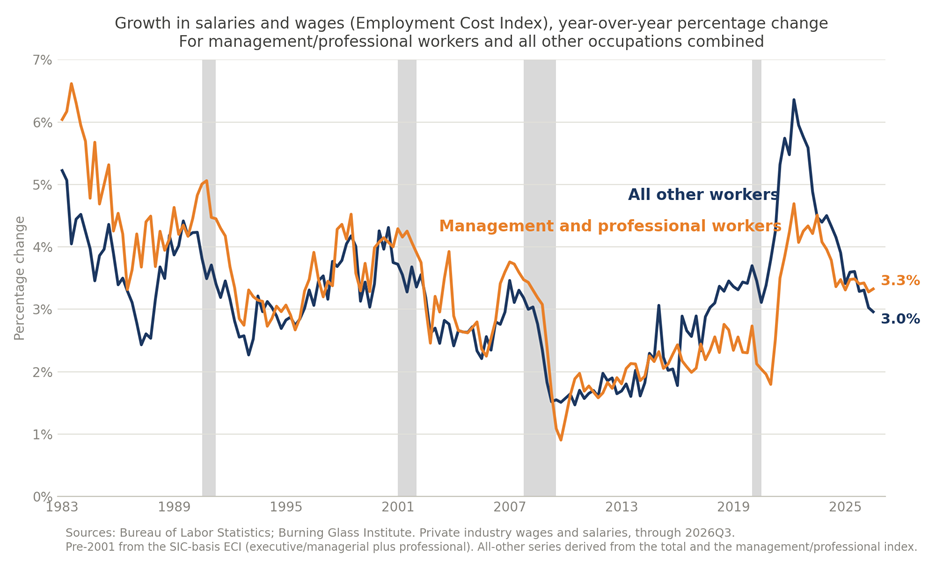
Pay. The gains are not showing up in paychecks. Since the end of 2019 productivity has risen more than twice as fast as real hourly pay; the two lines split in 2022 and have not rejoined. About three quarters of that gap is the fall in the labor share. The rest is consumer prices rising faster than the prices businesses sell at, which cuts what a paycheck buys without changing the share. Wage growth in the Employment Cost Index has converged near 3 percent for management and professional workers and for everyone else, white-collar pay a little above its 2019 pace and everyone else's below it.
10. Productivity up 16 percent since 2019, real pay up 7
11. Wage growth has converged near 3 percent for white-collar and other workers
What it adds up to. At the aggregate, the economy is doing well, and AI is the reason: it is the investment behind the growth, the stock market behind the spending, and, in my reading, the technology behind the output per hour. The same technology is what will make the next downturn different. Firms have learned to produce more with the same hours, so the same output now needs fewer people, and a drop in demand will need fewer still. Downturns also force firms to reorganize. Managers under pressure put in the labor-saving tools they had been postponing, and when demand returns the work is done by the technology rather than by rehired staff. That was the pattern in manufacturing: the booms of the late 1990s and mid-2000s hid the jobs that technology and trade were taking, and the recessions of 2001 and 2008 revealed them in a single step. I wrote about it last month, and I expect office work to follow the same path the next time around.
Data note: Charts 1 to 4: BEA NIPA, 2026Q3 advance estimate (Oct 29, 2026); population from BEA; AI-related investment uses BEA's contributions for information processing equipment, software and R&D (Table 1.5.2) plus an estimate for data center construction, four-quarter average; its pre-2023 pace is the 2015 to 2022 average of the same measure; net worth is the Fed's household and nonprofit series (FRED TNWBSHNO) over nominal GDP, same quarter, through 2026Q2. Charts 5, 6, 8 and 10: BLS Productivity and Costs, third quarter 2026 preliminary (Nov 5, 2026), nonfarm business sector; the trend in chart 5 is a log-linear fit to 2011Q1 to 2019Q4; chart 6 compares the average level of the latest four quarters with the average of the four before; chart 8 rescales the BLS labor share index to the 53.0 percent level in the release text; the split of the productivity-pay gap uses the labor share index against the ratio of real hourly compensation to output per hour, 2019Q4 to 2026Q3. Chart 7: BGI calculation from BEA real value added by industry and BLS hours, through 2026Q2 (Sept 30 vintage; Q3 industry data arrive in December); financial activities excludes imputed housing; advanced manufacturing is chemicals, computers and electronics, machinery, electrical equipment and motor vehicles. Corporate profits: NIPA corporate net operating surplus, through 2026Q2. Real disposable income +1.0 percent over the year to September, BEA. Chart 9: BLS Current Employment Statistics, October 2026 (Nov 6, 2026), seasonally adjusted; FIIPB = finance and insurance + information + professional and business services, real estate excluded, temp help netted out; revisions quoted from the release text. Chart 11: BLS Employment Cost Index, private industry wages and salaries, 2026Q3 (Oct 30, 2026); the pre-2001 series is spliced from the old SIC basis and "all other workers" is derived from the total and the management and professional index using ECI employment weights, so it is an approximation. The breakeven employment figure is an estimate: labor force (about 170 million) times population growth (0.24 percent a year), divided by twelve. BGI calculations.