
Labor Matters: The Jobs Report Is a Productivity Report
A weekend gift: a few interesting charts from today's jobs report.
Payrolls rose by 29,000 in September, and the two prior months were revised down by a combined 60,000. July is now a loss of 10,000 and August a gain of 133,000. The three-month average is 51,000 a month, the twelve-month average 41,000. The unemployment rate edged up to 4.2 percent, average hourly earnings are up 3.0 percent over the year, and the prime-age employment rate is 80.7 percent.
Almost no one talks about it, but for me the main point in this report is productivity, and the FIIPB story in particular. The economy is growing at a decent pace with almost no growth in hours worked. That is a big part of why payroll growth is weak, and the gains are concentrated in the industries where technology is changing work fastest. I made the full argument in the Labor Matters yesterday. This is what September added.
1. Productivity is running at twice its pre-pandemic pace
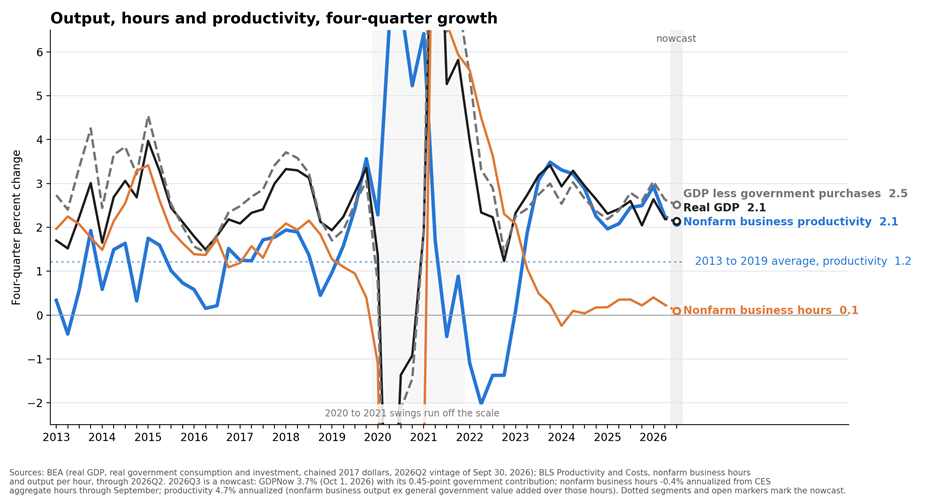
From 2013 through 2019, real GDP grew 2.5 percent a year, hours in the nonfarm business sector grew 1.8 percent, and productivity grew 1.2 percent. Since the start of 2023, GDP has grown 2.7 percent a year, hours 0.4 percent, and productivity 2.4 percent. Same growth, a fraction of the hours, twice the productivity. The third quarter will add to that. Today's report took the quarter's hours and employment path down: July and August were revised down by a combined 60,000 jobs, and aggregate hours were flat after growing 1.3 percent annualized in the second quarter. GDPNow has GDP growth at 3.7 percent. More output on flat hours puts third-quarter productivity growth at around 4 percent annualized. That last point on the chart is my nowcast, not a published number. BLS releases the actual figure in early November. One note on what is being compared: GDP covers the whole economy, while the hours and productivity lines cover the nonfarm business sector, about three quarters of GDP, which is where BLS measures productivity.
2. The white-collar core: output up, employment down
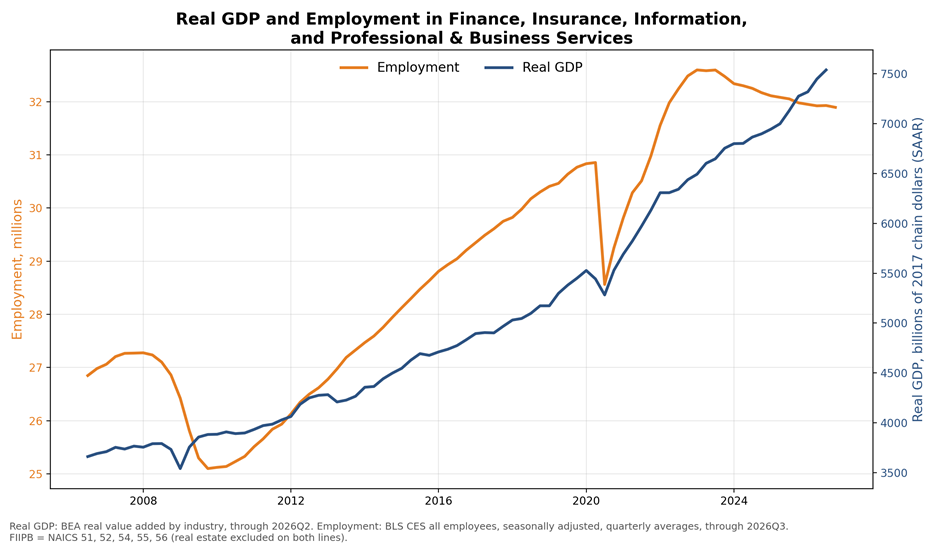
Real value added in finance, insurance, information and professional and business services, the group I call FIIPB, is up 16.1 percent from the end of 2022 through the second quarter of 2026. Employment in those industries is down about 2 percent over the same period, and the third quarter was the weakest stretch yet: down in July, August and September, and the September report revised the earlier months lower. The strongest case of fewer hours on the same output is here. Demand for what these industries sell is fine. They are meeting it with fewer people.
3. Where the gains are
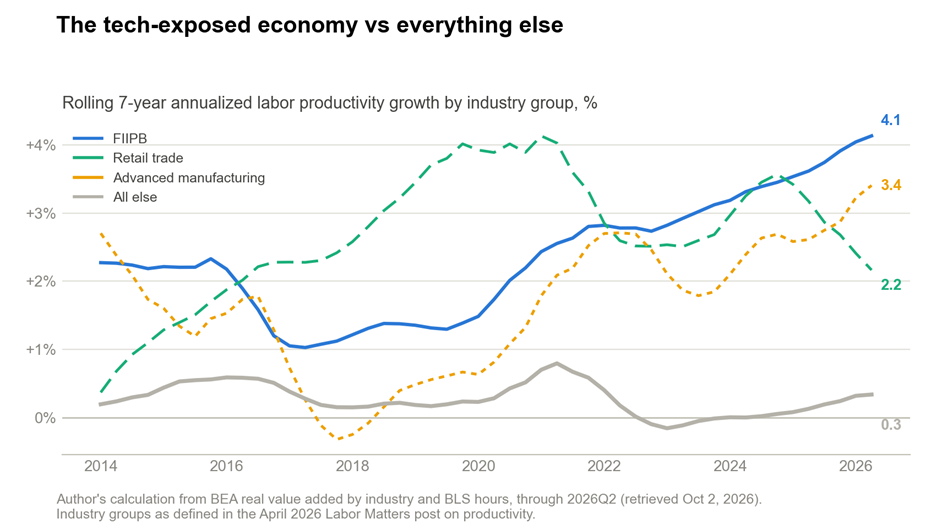
On a rolling seven-year basis, with a pre-pandemic base period, productivity in FIIPB is growing about 4 percent a year, advanced manufacturing 3.4 percent, retail 2.2 percent, and everything else 0.3 percent. If this were a broad cyclical rebound, the gains would be spread more evenly. They aren't, and that is a big part of why I credit AI and the technologies around it. I can't prove it, but it's where I come down.
4. FIIPB employment is still falling
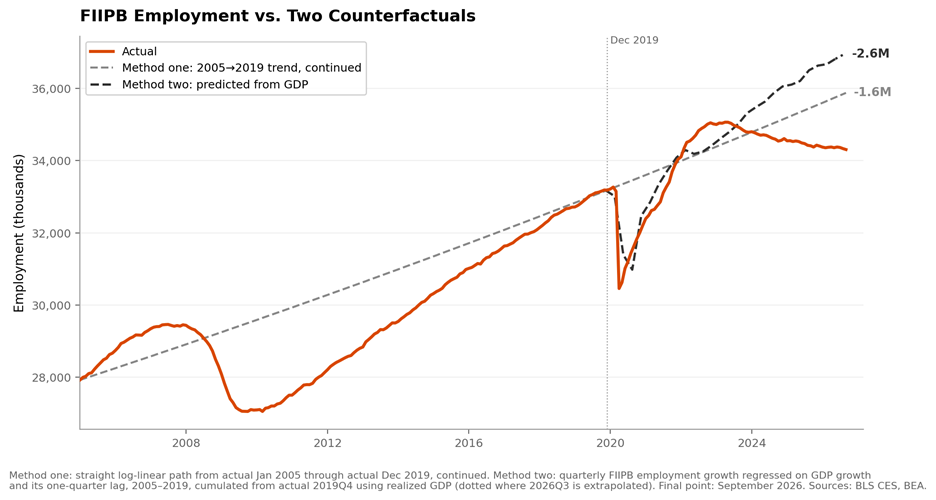
FIIPB employment fell another 26,000 in September. It is 757,000 below its April 2023 peak and has fallen in 31 of the 41 months since. Against its 2005 to 2019 trend the shortfall is 1.6 million jobs. Against a model that predicts FIIPB employment from GDP, the shortfall is 2.6 million. The model is simple: quarterly FIIPB employment growth regressed on GDP growth and its one-quarter lag over 2005 to 2019, then run forward from the actual level at the end of 2019 using the GDP that happened. The shortfall is up from 2.3 million in The Jobs That Never Arrived, mostly because the BEA's September 30 revision raised the GDP path.
5. The rest of the report
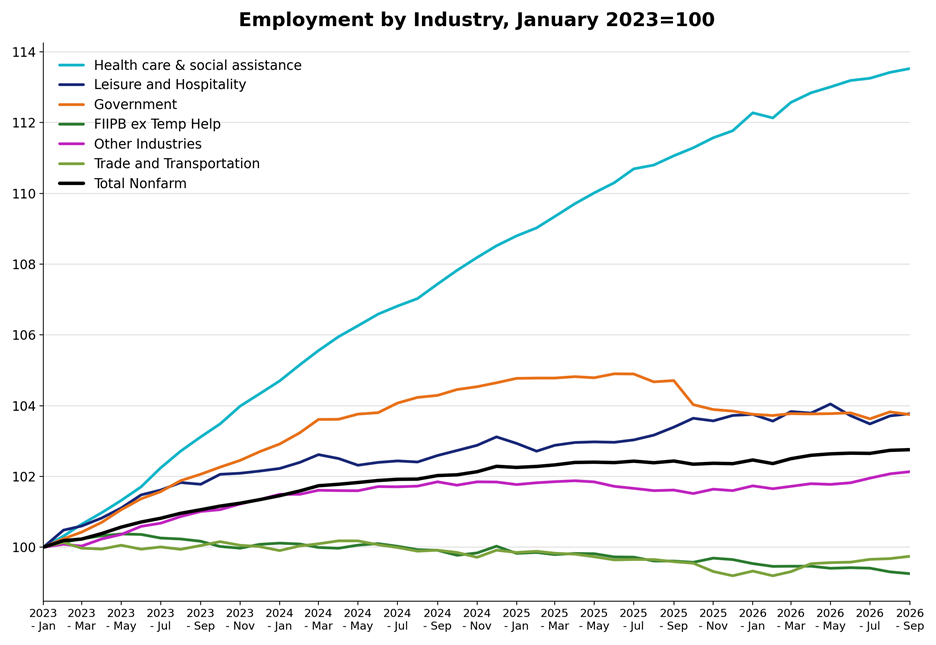
Health care and social assistance has added jobs at a 13.5 percent clip since January 2023, against 2.8 percent for total nonfarm. Over the past twelve months health care added 520,000 jobs and total nonfarm added 496,000, so everything else combined lost about 24,000. FIIPB and trade and transportation are both below January 2023.
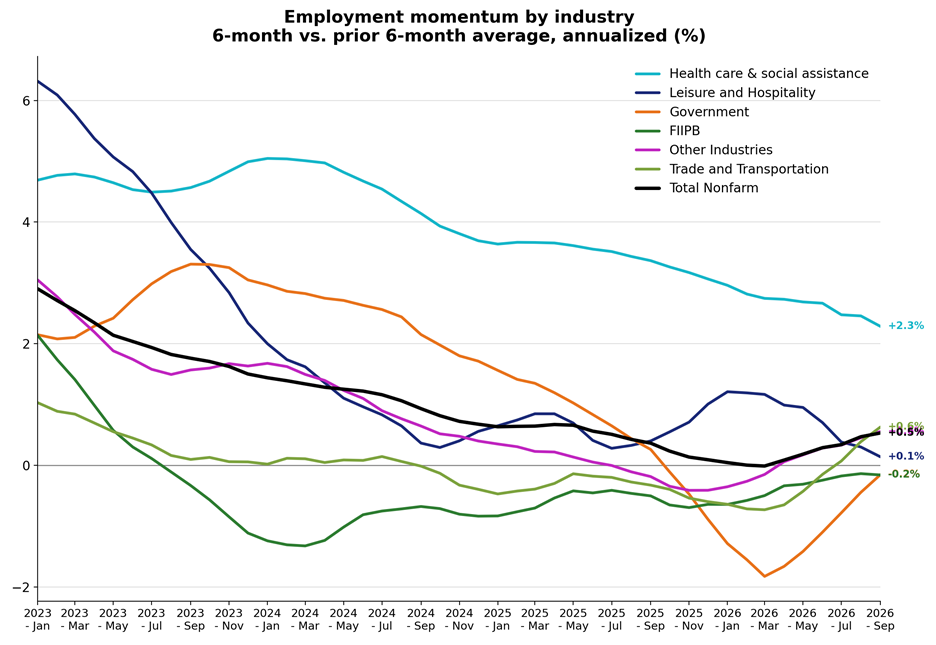
Health care is slowing, though. This chart shows momentum, the latest six months against the prior six, annualized. Health care is at 2.3 percent, its lowest since the chart begins in 2023, and its twelve-month growth is 2.2 percent against 3.4 percent a year ago. Total nonfarm is at 0.5 percent. FIIPB is still slightly negative.
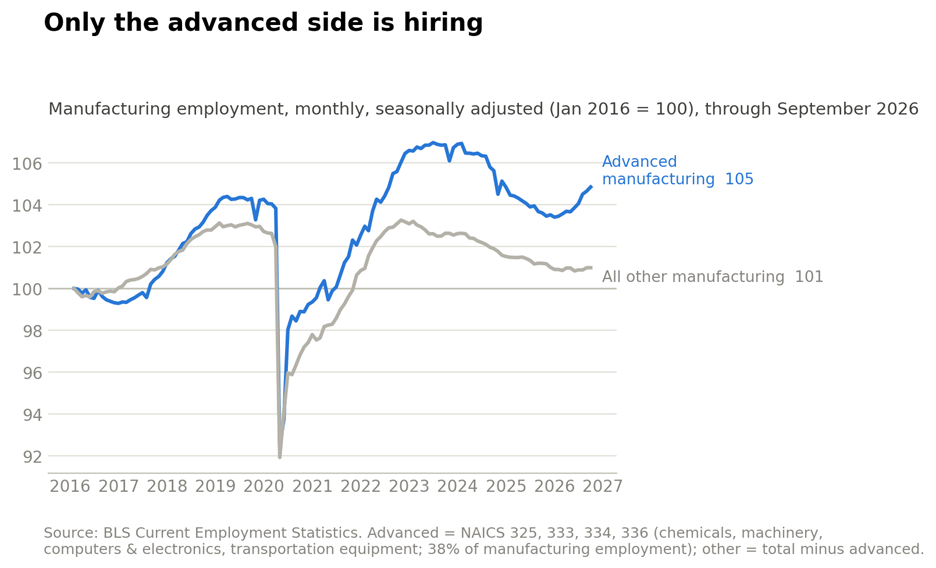
Manufacturing added 9,000 jobs in September and 40,000 over the year, all of it on the advanced side. Chemicals, machinery, computers and electronics, and transportation equipment added 56,000 jobs over the past twelve months. The rest of manufacturing lost 16,000.
6. There is no participation crisis
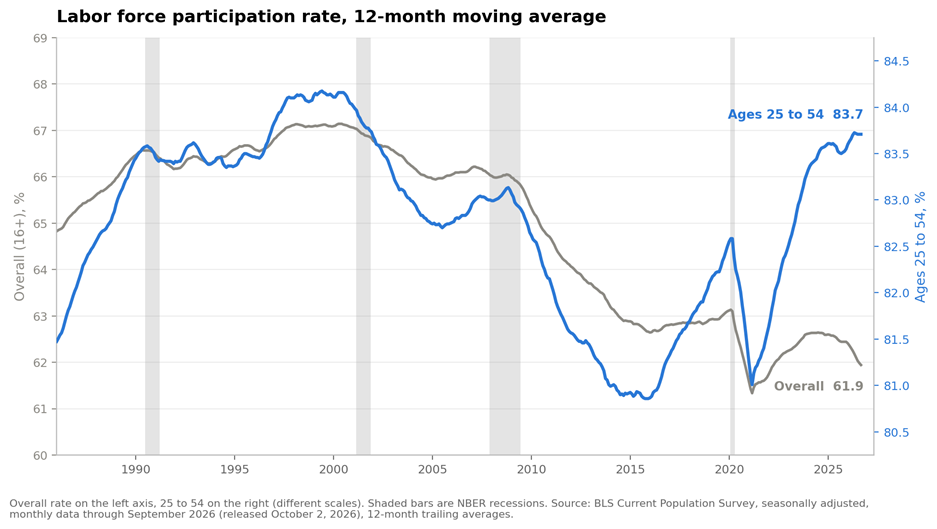
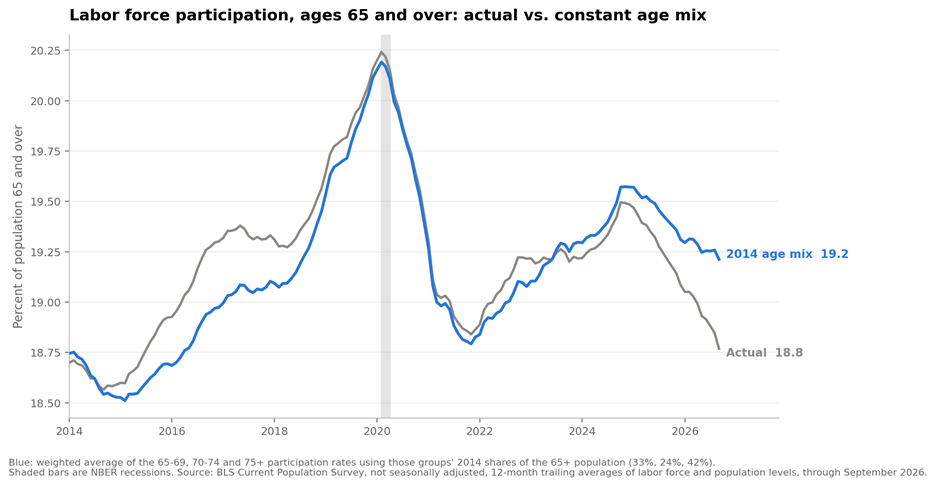
There has been a lot of talk about a labor force participation crisis. I think it is nonsense. The overall rate, 61.9 percent on a twelve-month average, is at its lowest since the spring of 2022, but the rate for ages 25 to 54 is 83.7 percent, about as high as it has been since 2001. The decline is almost entirely baby boomers retiring.
Participation among people 65 and over is 18.8 percent, down from 19.3 percent in 2024, and more than half of that drop is the aging of the 65-plus population itself: hold the age mix at its 2014 shares and the rate is 19.2 percent.
What I take from this month
Payrolls are weak, output is not, and the gap between them is productivity. The industries with the fastest productivity growth are the ones shedding workers, and FIIPB is the clearest case. Nothing in September changed that. I expect the third-quarter productivity number, out in early November, to make it harder to miss.
Data notes. BLS Current Employment Statistics and Current Population Survey, seasonally adjusted, September 2026 release of October 2, 2026. FIIPB is finance and insurance, information, and professional and business services; Real value added is BEA GDP by industry through 2026Q2, revised September 30, 2026; the industry productivity groups in chart 3 are defined in the April 2026 Labor Matters post on productivity. Chart 1 uses BEA real GDP and BLS nonfarm business hours and output per hour through 2026Q2, with 2026Q3 a nowcast from GDPNow and the September payroll hours. Chart 2 pairs the same real value added with CES employment in NAICS 51, 52 and 54 to 56, quarterly averages through 2026Q3.