
Labor Matters: The Jobs That Never Arrived
Last week's jobs report was solid: 162,000 new jobs. The industries I watch most closely lost 24,000. That's the pattern now. Since April 2023 the rest of the economy has added 4.4 million jobs, while finance, insurance, information, and professional and business services, the group I call FIIPB, have shed 700,000, falling in 29 of the past 40 months. And there was no recession. Everyone wants to know whether AI did it.
Employment data can't answer that directly. Whether the labor saver is generative AI, older automation, or an offshore team, the fingerprint is the same: work getting done with fewer people. What the data can show is whether that fingerprint is there, and how big it is. That takes a counterfactual, and counterfactuals are easy to abuse: pick a flattering benchmark and you can produce almost any number. So I built two, in very different ways. Both find well over a million jobs missing. The technical details are in a note at the end. And I'll tell you what I think took them.
FIIPB is banking, tech and media, consulting, accounting, back offices. It produces more than a quarter of GDP, and it's where many college graduates start their careers. For three and a half decades, FIIPB employment fell only in recessions and their aftermath. The decline underway now is the first with no recession attached. The economy is growing, and corporate profits are taking the largest share of GDP on record.
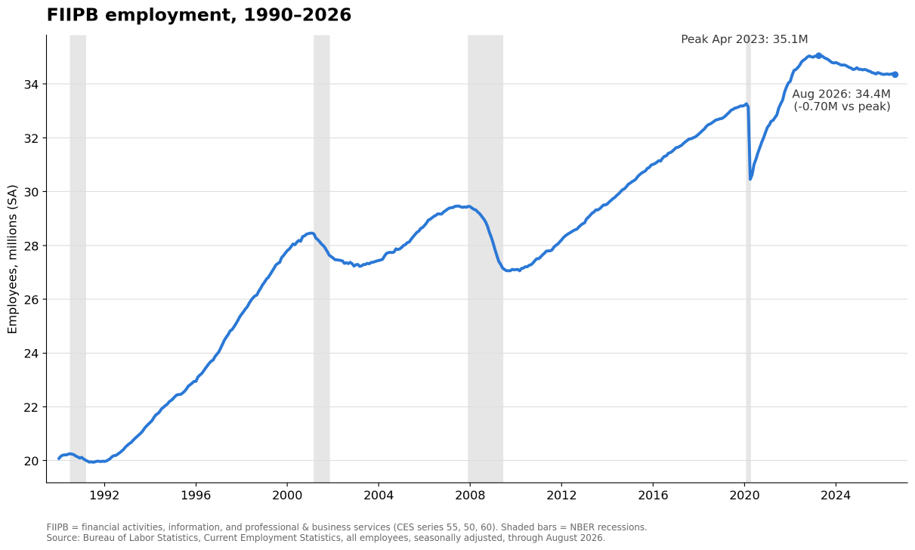
FIIPB employment since 1990. Shaded bars are NBER recessions. Source: BLS CES.
The first method is as simple as it gets: the straight path from where FIIPB employment actually stood in January 2005 to where it stood in December 2019, continued forward. That works out to 1.2% a year, and the window includes the financial crisis, so nobody can call it a boom-time trend. Employment crashed with the pandemic, regained the path by the end of 2021, then overshot it by more than half a million jobs at the peak in April 2023. Then it turned. It fell below the path in early 2024 and has been dropping away since. As of August the gap is 1.5 million jobs, and every one of them opened in the past two and a half years, nowhere near a recession.
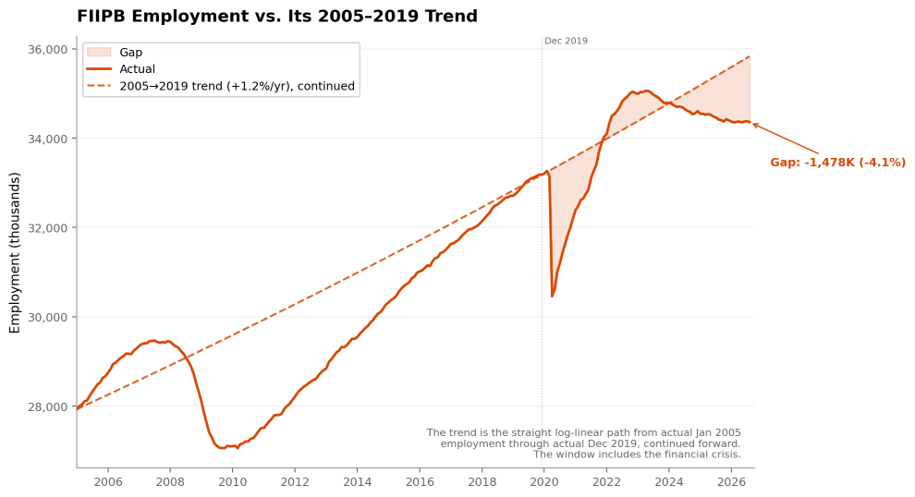
Method one: the straight path from actual January 2005 through actual December 2019 (+1.2%/yr), continued forward. Source: BLS CES.
The second method asks a different question: given how the economy actually grew, how many workers did these industries historically need? I estimated how FIIPB hiring tracked GDP growth from 2005 to 2019, allowing a quarter's lag because hiring follows output with a delay, fed the model what GDP actually did after 2019, and let it predict hiring through August 2026. The model knows nothing about the pandemic, yet it tracks the crash and the rebound closely. Then it loses track of reality. GDP kept telling these industries to hire, and they stopped. In every one of the 16 quarters since late 2022, well before employment dropped below the trend line, hiring has come in below what GDP implied. As of August, the model expects 2.3 million more jobs than exist.
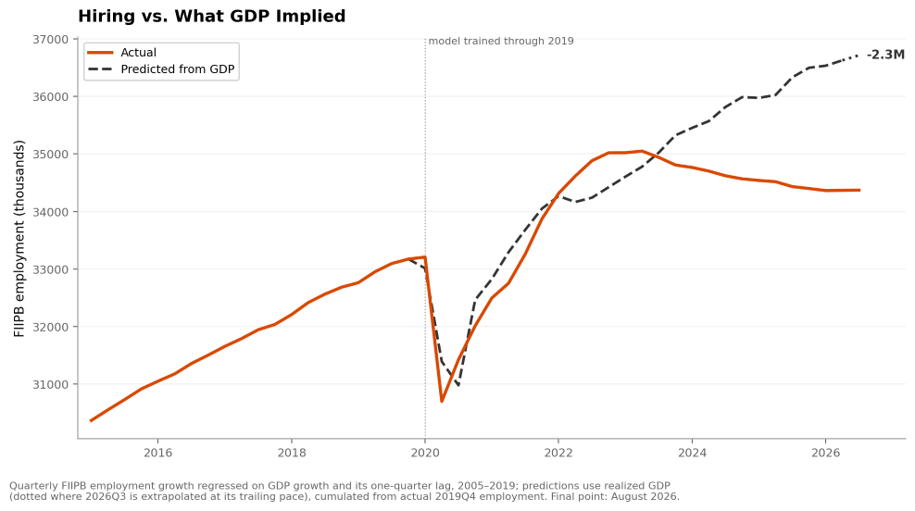
Method two: employment predicted from realized GDP by a model trained through 2019, through August 2026 (dotted where the last quarter of GDP is extrapolated). Sources: BLS CES, BEA.
Two very different counterfactuals, and both say well over a million: 1.5 million missing against the trend, 2.3 million against what GDP implied. And it isn't a temp-help story or a Wall Street story. Strip temporary help out entirely and a million or more jobs are still missing. Finance and information are close to their trends. The hole is in professional and business services: software services, corporate headquarters, and back-office work. Business support services, the call centers and document processors, has lost more than a quarter of its jobs since 2019 while the economy grew.
The rest of the economy makes the comparison stark. Run the same exercises on everything outside FIIPB and employment sits half a percent to two percent below its path. FIIPB is four to six percent below, and falling. Whatever did this hit these industries far harder than the rest of the economy.
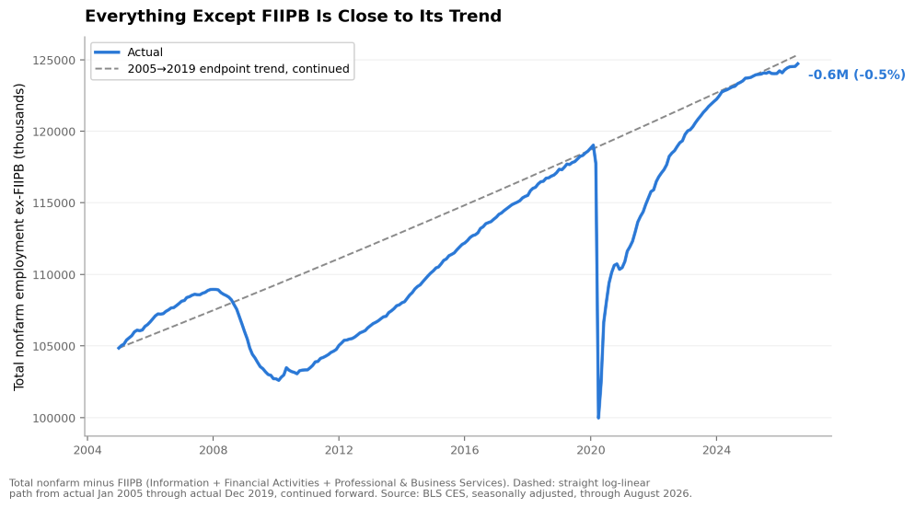
The same straight-path trend applied to everything outside FIIPB. Source: BLS CES.
Weak demand from high interest rates doesn't explain it. Demand is already inside the second method: the model is fed what GDP actually did, and GDP kept growing. And it wasn't a hangover from the 2021 and 2022 hiring binge. Working that off would explain falling back to the path, not sitting 1.5 million below it three years after hiring peaked.
The mechanism is mostly hiring that never happened: roles never opened, attrition never backfilled, and likely many junior positions quietly dropped from hiring plans. The BLS turnover data say the same thing: hiring rates in these industries are well below pre-pandemic levels while layoff rates are normal. A manager decides not to hire this quarter, then makes the same decision next quarter, and again after that. A manager who expects the tools to be better next year has one more reason to keep deciding that way. Over time those choices add up.
So is it AI? Here's where I stand. I'm not going to try to separate generative AI from older AI and the rest of the technology stack. Firms don't adopt them separately, and the data can't tell them apart. Some of this is offshoring, which is itself increasingly a technology story. And I suspect AI created a fair number of jobs in FIIPB over these years, so the gap I've measured is a net figure. But I'm pretty sure that technological improvement, and just as much the expectation of it, has already prevented more than a million white-collar jobs from being created in FIIPB, and probably more than two million across the whole labor market.
What worries me most is when this is happening: in an expansion, with record profits, and so far without layoffs. Recessions are when the layoffs come, and the jobs that technology has already made unnecessary don't come back afterward. Manufacturing employment looked fine in 2000. By 2010, after two recessions, a third of it was gone for good. My prediction is that the next recession will do to these industries what 2001 and 2008 did to manufacturing: turn gradual labor-saving into permanent job losses.
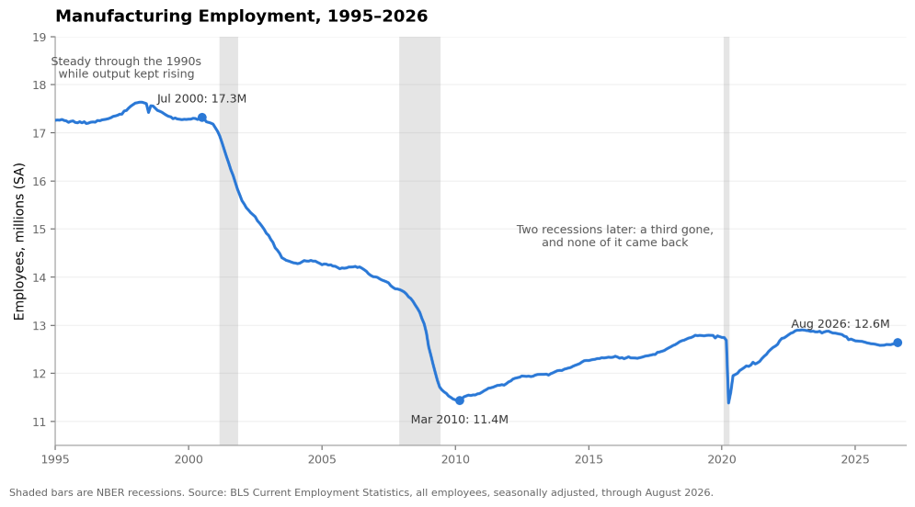
Manufacturing employment held steady through the 1990s despite automation and rising imports, then fell in two recession-shaped steps that never reversed. Shaded bars are NBER recessions. Source: BLS CES.
For young college graduates the news is already bad. FIIPB is where white-collar careers begin, and it is still shrinking. Hiring freezes protect incumbents and punish entrants: experienced workers keep the jobs they have, while new graduates compete for openings that no longer exist. It shows in the unemployment numbers. From 1996 through 2019, in every single month, 22-to-26-year-olds with a bachelor's degree had lower unemployment than those with only some college. Since late 2025 they've had higher. Their rate has risen two full points since 2019, to 6.1 percent, while the rates for their peers with less education rose less than one. Graduates are the first casualties. A recession would spread the damage to others. Every month the gap widens, and the door into the professional economy narrows a little further.
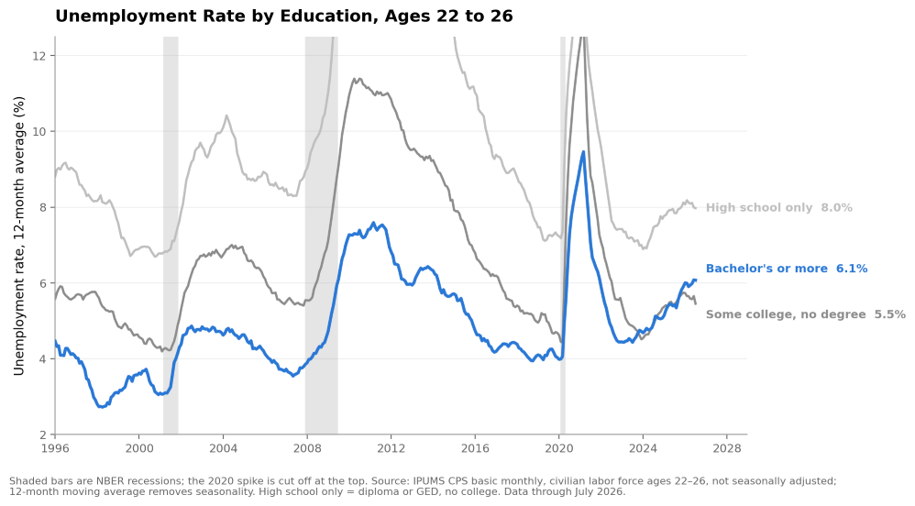
Unemployment rate by education among 22-to-26-year-olds, 12-month average. Source: IPUMS CPS.
Those jobs didn't disappear. They just never arrived.
Methodology: Employment is BLS Current Employment Statistics, seasonally adjusted, through August 2026. Method one is the log-linear path from actual January 2005 employment through actual December 2019 employment (+1.16% a year), continued forward; starting the line in any January from 2002 through 2008 gives gaps of 1.0 to 1.6 million. Method two regresses quarterly FIIPB employment growth on real GDP growth (BEA NIPA) and its one-quarter lag over 2005Q2–2019Q4 (R² 0.67; coefficients 0.49 and 0.58, both significant with Newey-West standard errors), then cumulates predicted growth from actual 2019Q4 employment using realized GDP through 2026Q2, with 2026Q3 at the trailing four-quarter pace. Real GDP growth and corporate profits (13.3% of GDP in 2025, the highest on record; 14.9% in 2026Q2) are from BEA NIPA. Manufacturing employment (CES) was 17.3 million in July 2000 and 11.4 million at its March 2010 trough. Hiring and layoff rates: BLS JOLTS through July 2026. Unemployment by education: IPUMS CPS basic monthly, civilian labor force ages 22–26, weighted, 12-month moving averages of not-seasonally-adjusted rates, January 1996 through July 2026; bachelor's-or-more was below some-college-no-degree in all 288 months from 1996 through 2019 and has been above it in each of the ten months through July 2026.