
Labor Matters: Half the Labor Force Is Having a Very Good Year
I've spent much of this year writing about young college graduates and how hard their job market has become. All of it holds up. But I've been telling half a story. Judged by unemployment, the 88 million American workers over 22 without a bachelor's degree, more than half the labor force, are having one of their best runs in more than twenty years.
One note on measurement. The average unemployment rate vary significantly across groups. Some groups always have higher unemployment rates than other. So instead I rank each group's current rate against that group's own record since 2003. Fifty is a typical year for them, and near zero is about as good as it has ever been. That puts a machinist and a software developer on one scale.
Start with something I've written about before.
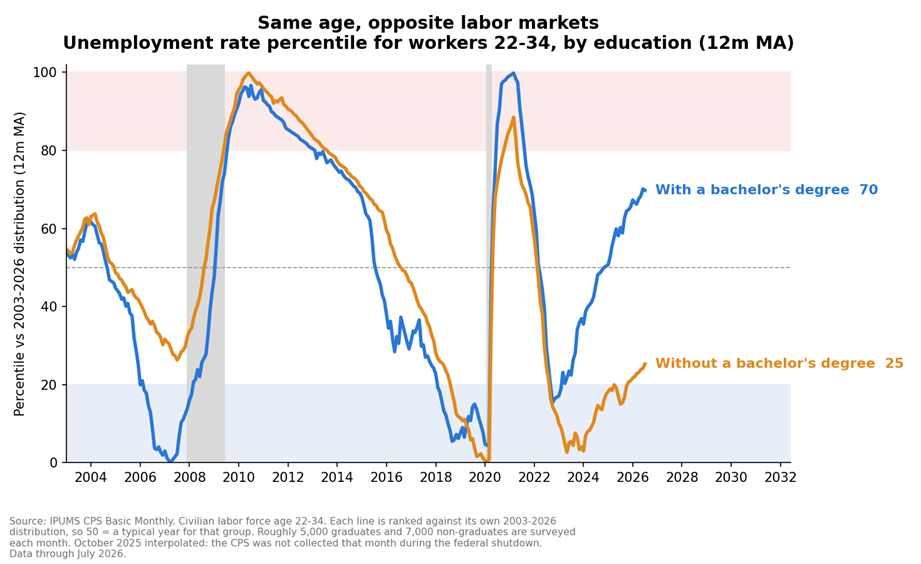
These are workers aged 22 to 34, split by whether they finished college. For twenty years the two lines moved together, through the housing bust and the pandemic. In 2024 they came apart. Young graduates now sit at the 70th percentile of their own history. Young non-graduates the same age sit at the 25th. Keep the scale in mind throughout: lower is better.
That matters for how we explain the graduate story. If this were about inexperience, or a soft economy, or a general pullback in hiring, the orange line would have moved too. It didn't. Something is hitting one kind of worker far harder than the other.
Widen the lens to everyone over 22.
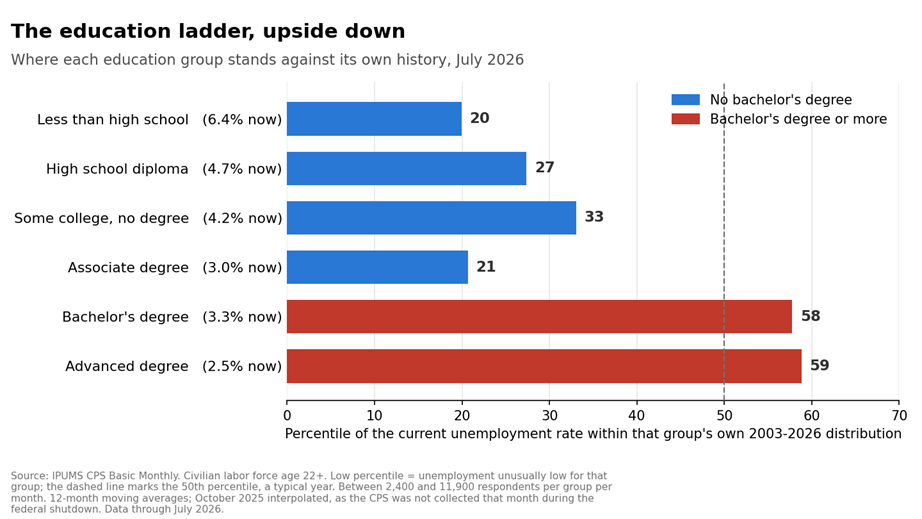
Every group without a bachelor's degree is in the bottom third of its own history, and both groups with one are above their median. The levels still run the usual way, with dropouts at 6.4 percent unemployment and advanced degrees at 2.5 percent, so nobody has traded places. Workers with some college but no degree are the worst-positioned non-graduates, at the 33rd percentile.
Now sort everyone by occupation instead of education.
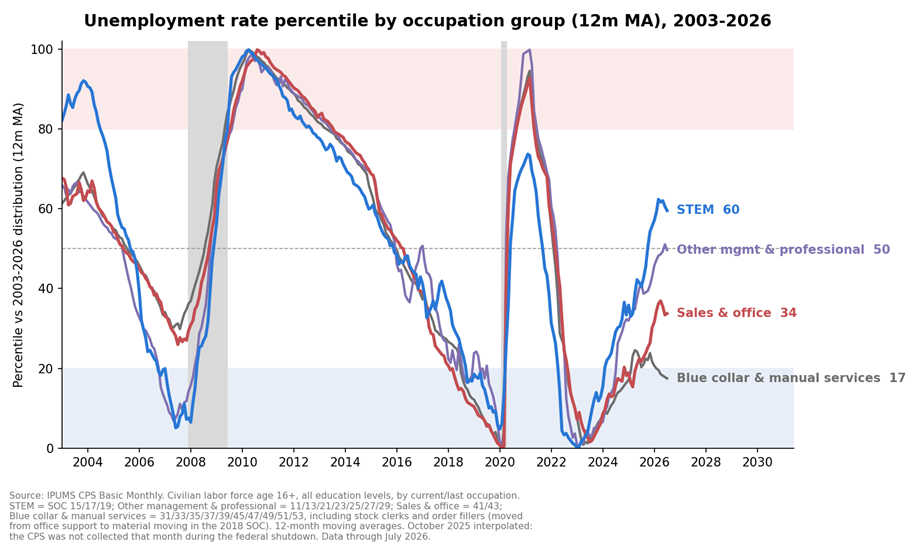
This covers every worker at every education level. The four lines moved as one from 2008 through 2023, then fanned out. Blue-collar and manual-service work, the largest group at 65 million people, is at the 18th percentile, and STEM is the only group above its median.
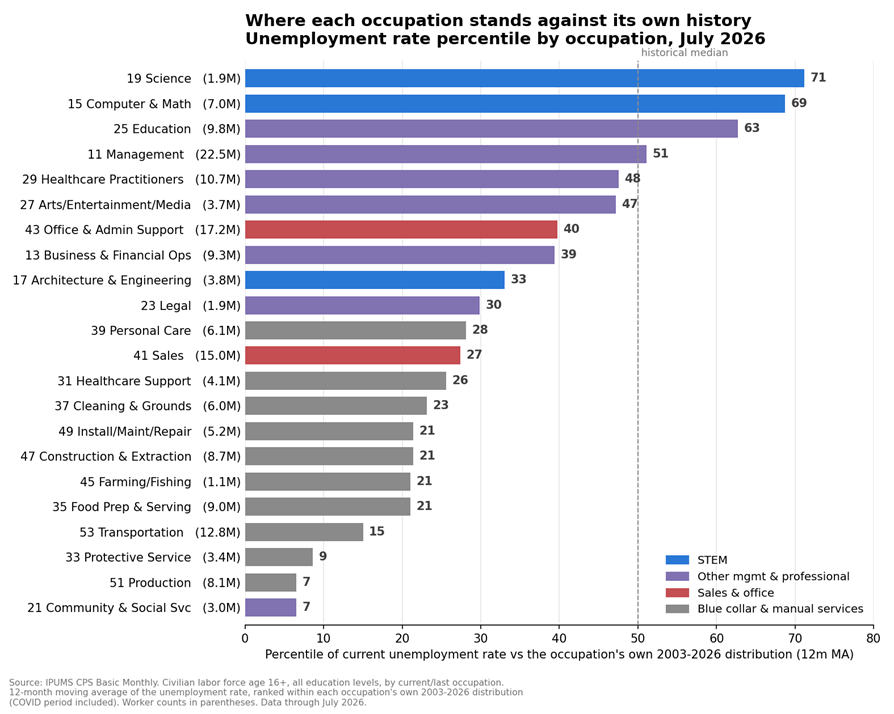
Occupation by occupation, the ordering is almost too neat. The bottom is physical and in-person work: production, protective service, cleaning, construction, transportation, healthcare support. The top is knowledge work. Nobody sorted these jobs by whether they happen at a desk, but that is roughly what came out. It also explains the some-college anomaly, since that's the group most likely to hold an office job without a degree.
Splitting each occupation group by education complicates this in a useful way. Among non-graduates, those in sales and office jobs are the clear laggards at the 40th percentile, against the 9th for management and skilled professional roles and the 22nd for blue-collar work. The task divide is real inside the non-degree workforce.
The divide also has a geography, and it runs with density.
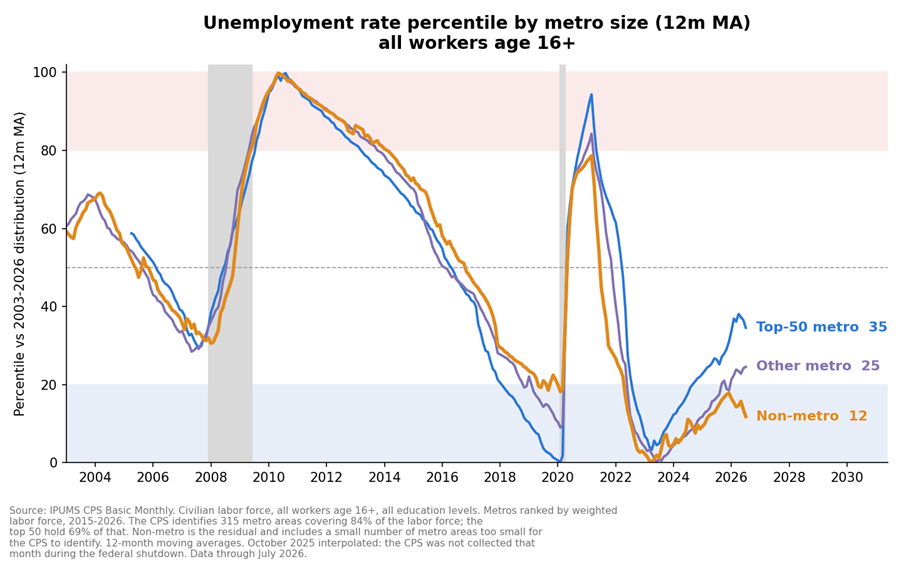
Non-metro America is at the 12th percentile and has barely moved since 2023, while the fifty largest metros have climbed thirty points. Office work is a metropolitan product, and the places with least of it have felt least of this.
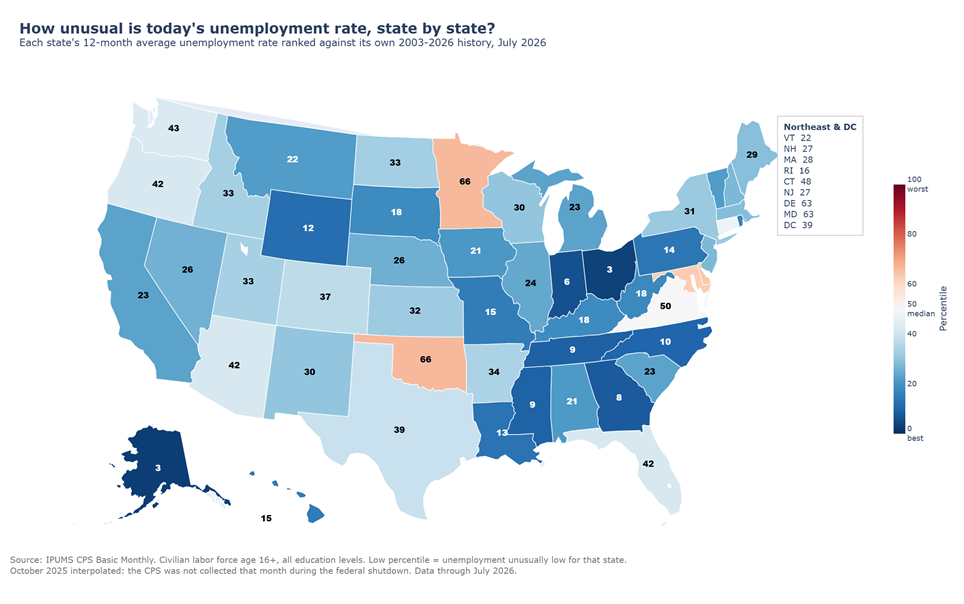
State by state, the map is blue. Forty-seven of fifty-one jurisdictions sit below their own median, and the darkest run through the industrial Midwest and the Southeast. Ohio, Indiana, Georgia, Tennessee and North Carolina are near their best readings in two decades. This map would have looked unimaginable in 2010, when those were the states people wrote elegies about.
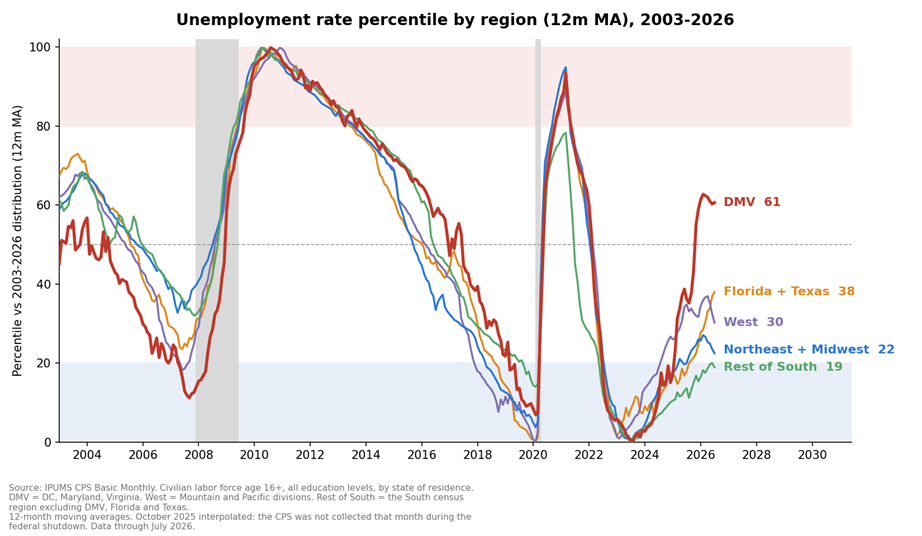
Grouped into regions, four of them covering more than 160 million workers all sit between the 19th and 38th percentile, moving together as they have for twenty-three years. This isn't a few lucky states pulling an average around. Only the Washington area breaks away, for reasons I wrote about in the last Labor Matters.
Put the cuts together and the weak spot in this labor market has a precise profile: educated, metropolitan, desk-based. Outside that profile, most of the country is somewhere between fine and historically fortunate.
Part of the non-graduate strength is probably supply rather than demand. Immigration enforcement has thinned the pool of less-educated workers over the past year and a half, and the construction and factory-building boom has soaked up much of what remains. Data centers, after all, are built by electricians, so the same technology that may be cooling desk work is hiring hard hats. What supply can't explain is the graduate side: fewer workers at the bottom says nothing about why unemployment is rising at the top.
I'll keep writing about young graduates, because what's happening to them is real and it's early. But the same data shows tens of millions of people in the best position they've held since before the financial crisis. Young graduates are 20 million workers, about one in eight. They are worth writing about. They are not the labor market.
A note on method
Every series is a 12-month moving average, since monthly CPS estimates for subgroups are noisy. The 2003 baseline cuts both ways: it contains two downturns that hit manual work hardest, so an 18th-percentile blue-collar reading partly reflects how bad the baseline was, while rising attainment means today's non-degree population is more negatively selected, which biases against the finding. And the CPS wasn't collected in October 2025 during the shutdown, so each window here contains one interpolated month.