
Labor Matters: Young college graduates are finding jobs at the slowest pace in decades
The evidence that young college grads are struggling in the labor market continues to mount.
A 22-to-26-year-old with a bachelor's degree who was unemployed last month had a 23 percent chance of being employed this month, averaged over the past two years. That is the lowest reading since 2003, the start of my comparison window. It is below the trough after the Great Recession, when the same figure bottomed at 24.5 percent in early 2011. In the late 2010s it was about 32 percent. And this is happening with the unemployment rate at 4.2 percent, growth near 3 percent, and corporate profits at a record share of GDP.
In August I wrote that the college advantage is breaking down for young workers, and in my assessment of AI's impact I put the rise in their unemployment rate at about 1.5 points since late 2022, three times the rise for young workers without a degree.
This piece looks at hiring directly. The Current Population Survey interviews the same households in consecutive months, so I can follow each unemployed person and count how many are employed a month later. Economists call that the job-finding rate. It is a good measure of how hard it is to get hired.
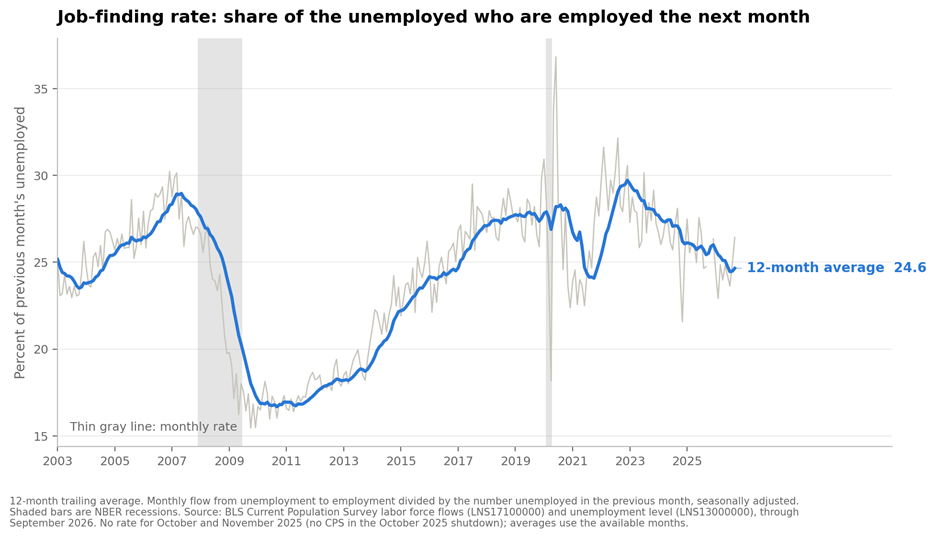
For the labor market as a whole, the BLS publishes this flow. On a 12-month average, 24.6 percent of the unemployed found work in a given month through September (the BLS series runs a month ahead of the microdata used below), down from 25.4 a year earlier and 27.7 in 2019. That is the 43rd percentile of its history since 2003: below the middle, nothing too unusual. The rest of this piece cuts that number by education, using the survey microdata.
Graduates of all ages
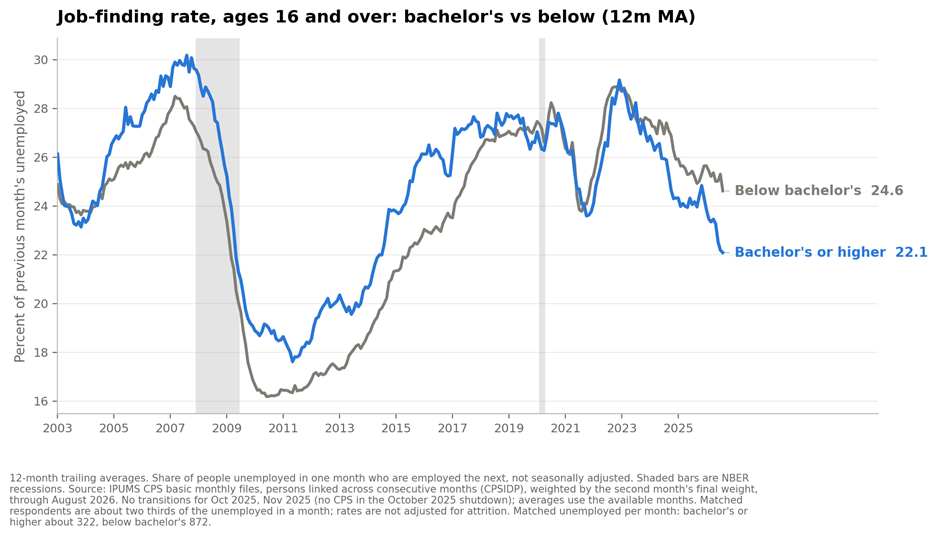
Start with everyone 16 and over. In 2003 and 2004 the two groups were about even. In every 12-month window from 2005 through 2018, graduates found jobs faster than non-graduates, by about two points. The order reversed briefly in 2020 and again in 2022, when job losers on temporary layoff were being recalled, and since late 2023 graduates have been slower in every window. The gap is now 2.5 points the other way, after reaching 3 points in July, wider than at any point in the 2022 episode. On 12-month averages through August, 22.1 percent of unemployed graduates found work in a given month, against 24.6 percent of unemployed non-graduates, by coincidence the same figure as the overall rate.
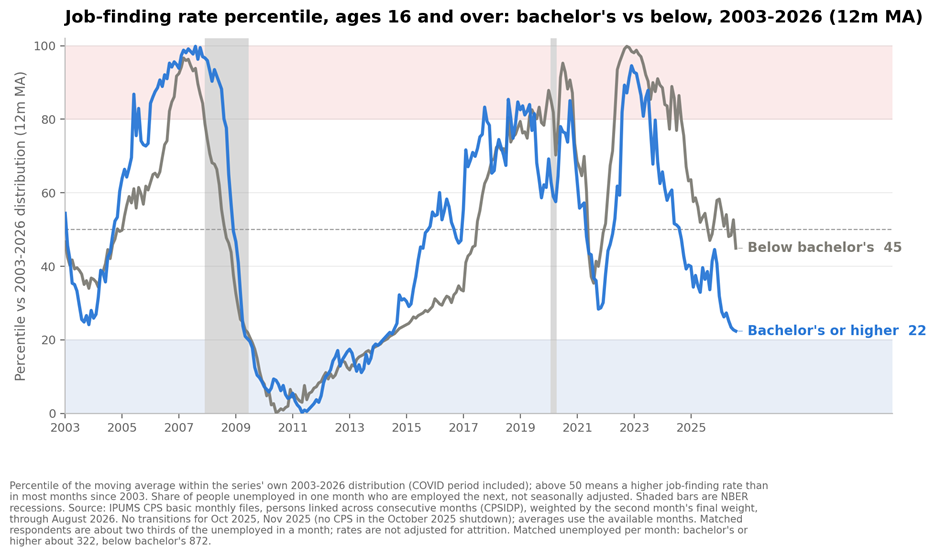
The percentile chart puts each line against its own history since 2003. Non-graduates sit at the 45th percentile, a little above the overall unemployed, and about what you would expect in a year with 4 percent unemployment. Graduates are at the 22nd. Their rate was last this low in mid-2014, five years into the recovery from the Great Recession.
Ages 22 to 26
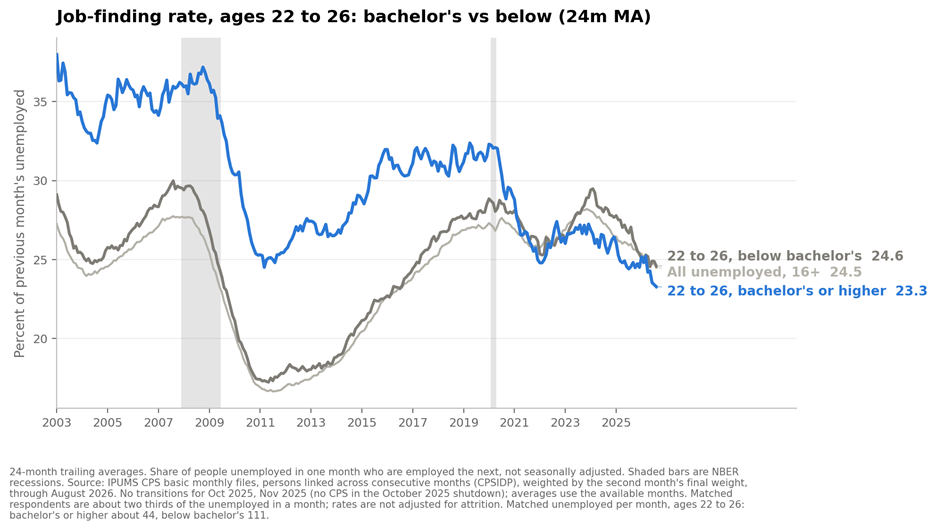
The young are where it concentrates. In the late 2010s, graduates aged 22 to 26 found jobs at 30 to 32 percent a month, well above young workers without a degree. Since 2019 the graduate rate has fallen from 31.6 percent to 23.3, a drop of 8 points, against 27.9 to also 24.6 for young non-graduates, a drop of 3. The graduate line has been below the non-graduate line in all but two 24-month windows since late 2022. Over just the past two years the non-graduates fell more, from 29.5 percent in early 2024, but they started from a stronger place. Graduates entered the past two years from a position that was already weak and are now at a level they never reached before.
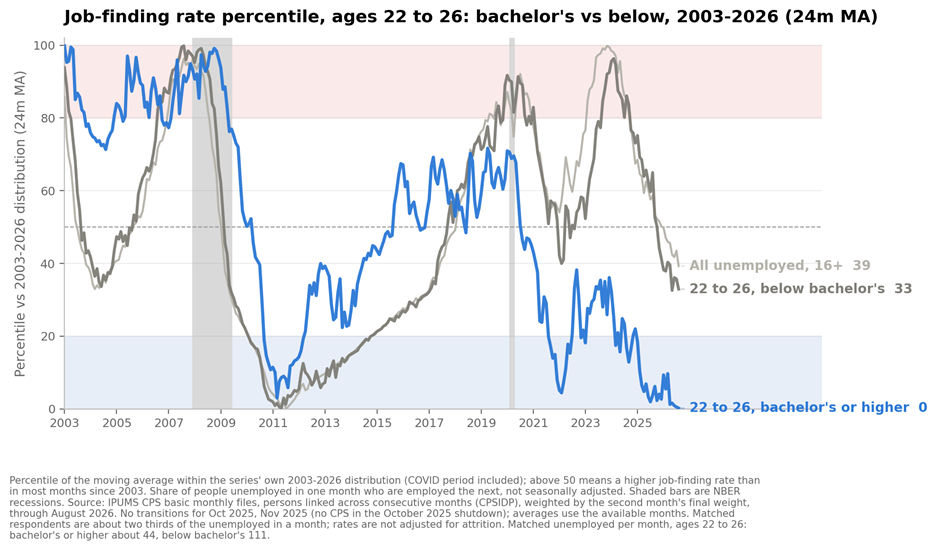
That 23.3 percent is the lowest reading in the series. In every 24-month window since 2003, including the whole of 2009 to 2012, young graduates found jobs faster than they do now. Young non-graduates are at the 33rd percentile of their history, a soft reading, not an alarming one.
Why graduates
I can't identify the cause from these flows alone, but the pattern fits what I have documented elsewhere: hiring has weakened most in the white-collar industries that absorb young graduates, over the same years in which AI became able to do junior analytical and writing work. That is where I'm leaning. Two things are hitting the same people. First, I think AI does the tasks juniors used to do, so the entry-level professional job is the one employers can most easily not fill. A junior analyst is much more automatable than a senior one, and for now I expect displacement to stay concentrated at the entry level. The hiring freeze I documented in finance, insurance, information and professional and business services, where between 1.5 and 2.6 million jobs are missing depending on the method, as of this month's update, lands on the people who need to be hired into those industries.
Second, the share of each cohort finishing a bachelor's degree has risen for decades. Among 22 to 26 year olds it went from 22 percent in 2003 to 31 percent in 2019 and 33 percent now, so more graduates are competing for a pool of entry-level professional jobs that was growing slowly even before 2022. The glut didn't cause the deterioration, but it means a drop in demand for junior work shows up in graduates' numbers faster than it would have a generation ago.
What worries me is the setting. Everything in these charts happened under conditions that could hardly be more favorable. The economy is strong, profits are at a record, the layoff rate is about as low as it gets.
The hiring side of the adjustment is happening now, in these numbers. The layoff side waits for the recession, and recessions are often when firms reorganize around technology they have already adopted. For young graduates the adjustment has already started. I expect the next downturn to make all of this much harder to miss.
A note on the data
The flows come from the IPUMS version of the CPS basic monthly files. Respondents are in the survey for four months, out for eight, and back for four, so about two thirds of the people unemployed in a month can be linked to their record the next month. I weight the linked pairs by the second month's survey weight and do not adjust for the respondents who drop out. The CPS was not collected in October 2025 during the shutdown, so there are no transitions for October or November 2025. The moving averages use the months that exist, which makes the latest "12-month" figures averages of ten months. The young-graduate series rests on about 45 matched unemployed people a month, roughly 1,000 per 24-month window, which is why I use 24-month averages for the age groups and 12-month averages for everyone else. The percentile charts rank each series' moving average within its own 2003 to 2026 history, COVID months included.