
Labor Matters: The Education Penalty
Something unusual is happening in America’s most educated metro areas.
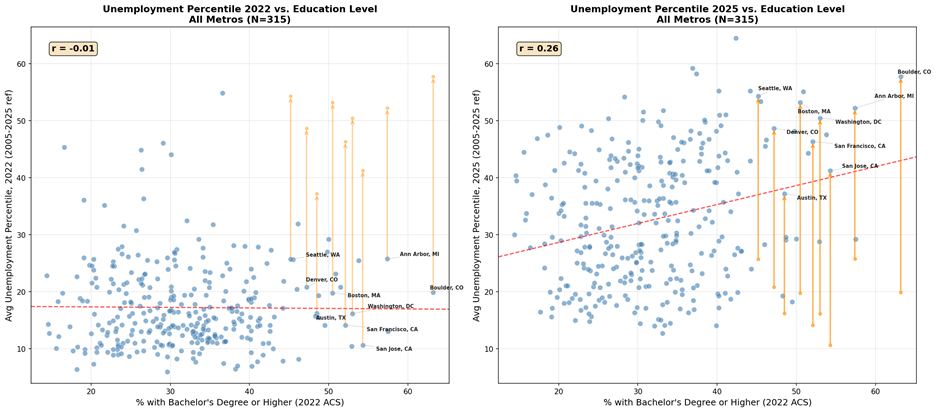
In 2022, there was essentially no relationship between a metro area’s share of college graduates and where its unemployment rate stood relative to its own history. The correlation was -0.01 — as close to zero as data gets. Educated and less-educated metros alike were scattered randomly around their historical norms.
Three years later, that correlation is 0.26 — modest but meaningful across more than 300 metropolitan areas. The entire relationship emerged in three years.
Source: BLS (LAUS), Census Bureau (ACS 2022), and author’s calculations
How I Measure It
For each of the 393 metropolitan statistical areas tracked by the Bureau of Labor Statistics, I calculate the monthly unemployment rate’s percentile ranking against that metro’s own 2005–2025 history. A reading of 10 means the metro’s unemployment rate is lower than 90% of its own monthly observations over the past two decades. A reading of 50 means it is at its historical median. I then average these monthly percentiles over each calendar year to get a summary measure for 2022 and 2025.
The Headline Numbers
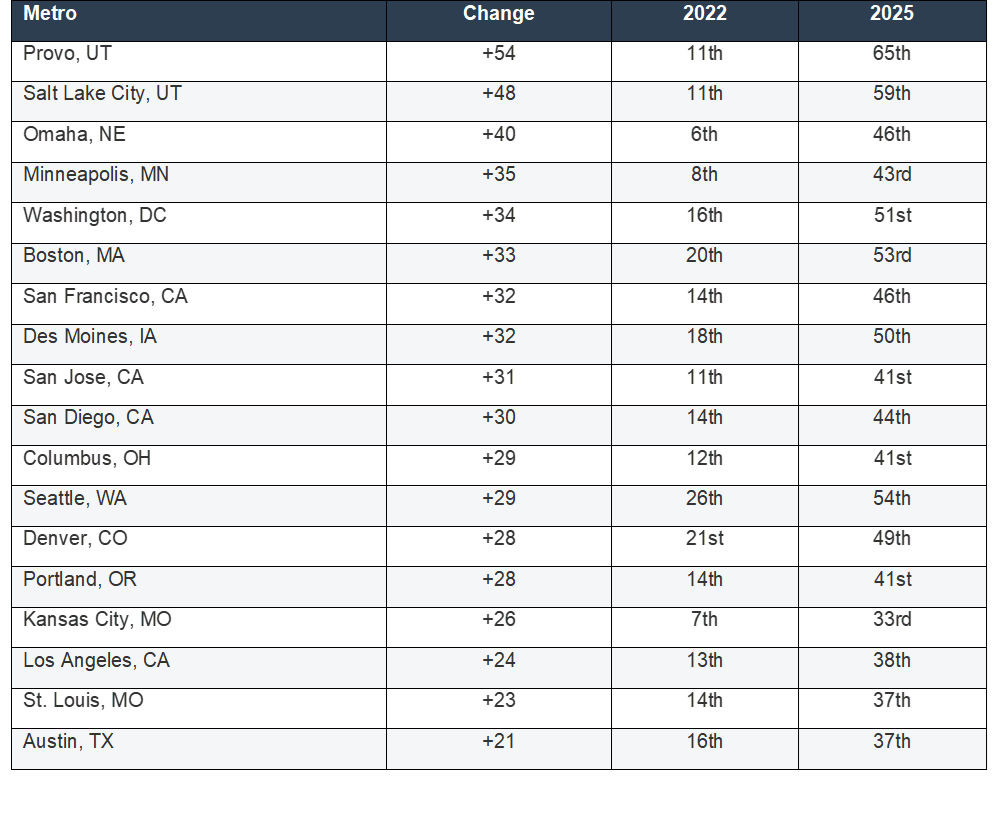
Start with the names you would expect. San Jose averaged a 2.9% unemployment rate in 2022, placing it at the 11th percentile of its own range — a tight labor market. By 2025, its rate had risen to 4.3%, pushing it to the 41st percentile. A 30-point jump. San Francisco went from the 14th percentile to the 46th. Seattle from the 26th to the 54th. Boston from the 20th to the 53rd. Washington, D.C. from the 16th to the 51st.
But the pattern extends well beyond the usual tech suspects.
Minneapolis jumped from the 8th percentile to the 43rd. Des Moines from the 18th to the 50th. Omaha — not a city typically associated with tech layoffs — surged from the 6th percentile to the 46th, a 40-point swing. Kansas City went from the 7th to the 33rd. Denver from the 21st to the 49th.
What all of these metros share is not a concentration of software engineers. It is a concentration of college graduates.
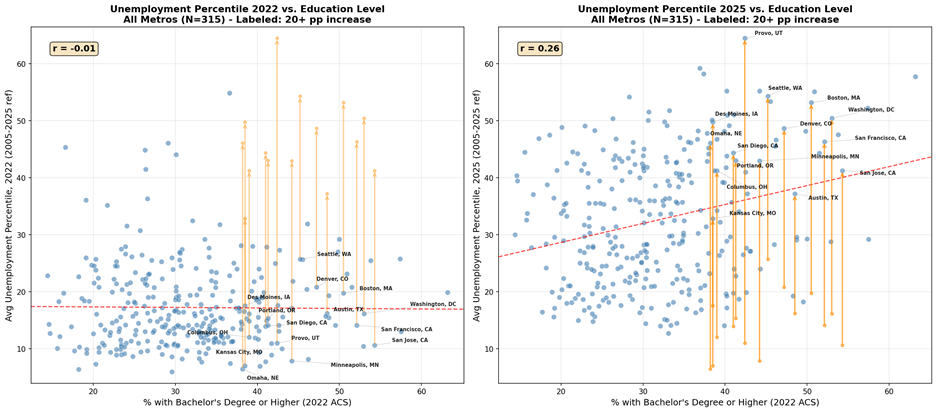
Source: BLS (LAUS), Census Bureau (ACS 2022), and author’s calculations. Orange arrows show the percentile shift from 2022 to 2025.
The Pattern Is New
Ninety percent of MSAs saw their unemployment percentile rise between 2022 and 2025, with a median increase of 14 points. But the most educated metros moved further and faster. In the scatter plot, the 2022 panel shows a flat cloud. The 2025 panel shows a clear upward tilt concentrated on the right side — where the educated metros are.
The Geography of the Shift
The metros experiencing the largest swings span every region of the country. Among metros with at least 300,000 jobs and a college-graduate share above 38%, every one saw a double-digit percentile increase:
Why is this happening?
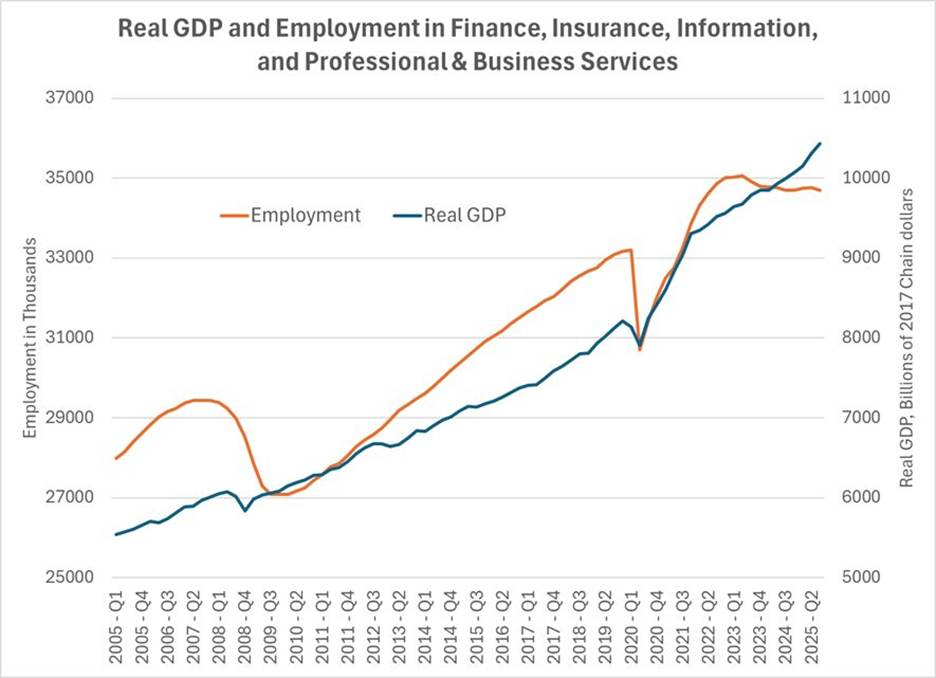
In a recent Labor Matters, I showed that Finance, Insurance, Information, and Professional & Business Services — what I call FIIPB — has broken from the pattern that defined it for decades. Output keeps climbing. Employment does not. FIIPB accounts for more than 40% of GDP. Since 2022, its real output has grown while headcount has gone flat or fallen. The old equation — grow more, hire more — no longer holds in the white-collar core.
But FIIPB is not evenly distributed across the country. It is concentrated in exactly the metros where college graduates cluster. When those sectors stop hiring — or start cutting — the impact lands hardest in the most educated labor markets. That is what the data above is capturing.
This metro-level pattern is consistent with a growing body of evidence that the labor market for college-educated workers — particularly younger ones — is deteriorating. It is not a coastal story or just a tech story. It is an education-concentration story, visible from Omaha to San Jose.
The national unemployment rate sits at 4.4%. It looks low. But that number averages over local realities that are pulling apart. America's most educated metros are running at more elevated unemployment — by their own standards. Three years ago, this divergence did not exist. As young college grads continue to struggle finding work, this divergence is more likely to widen than to close.