
Labor Matters: Students Spent a Decade Following the Money. AI May Have Just Moved It.
Introduction
In Fall 2025, undergraduate enrollment in Computer Science fell 8.1% — the first decline in nearly a decade of uninterrupted growth. CS graduate enrollment fell 14%. Engineering, in contrast, grew 7.3%.
These three numbers carry a large signal. They mark a possible inflection point in a decade-long story — one in which American college students moved with unusual consistency toward higher-paying fields. That story, and what may now be changing it, is the subject of this article.
What we found:
For ten years, the story of college majors was simple: students followed the money. Higher-paying fields gained share. Lower-paying fields lost it. The pattern held year after year, across most demographic groups, with rare exceptions.
Computer Science was the defining beneficiary, and the humanities the defining losers. CS's share of young U.S.-born bachelor's degree holders rose from 2.3% to 5.6% — a 138% increase. Over the same period, Education and Teaching fell 28%, English fell 40%, and History lost nearly half its share. These are not small fluctuations; they are sustained, ten-year trajectories.
The shifts translate into large projected changes in the workforce. Applying current major-to-occupation pathways to the changing distribution of graduates, projected supply of software developers grew 43% over the decade — by far the largest single-occupation gain. Projected supply of elementary and middle school teachers fell 22%.
Students may have spent a decade preparing for a labor market that is now changing. The CS boom of 2014–2024 was a rational response to visible labor-market signals. The 2025 reversal may be equally rational. What changed is the market — generative AI emerged at scale just as the decade's CS pivot reached its peak.
The CS boom may already have crested. That 8.1% Fall 2025 drop was the first decline in CS bachelor's enrollment in nearly a decade, and CS graduate enrollment fell 14%. Engineering moved in the opposite direction, growing 7.3%. Students aren't abandoning STEM — they are reallocating within it, away from the most AI-exposed field.
Follow-the-money wasn't only about shifting majors. It was also about where each major led. Even if no student had changed what they studied, projected occupational supply would still have moved sharply toward technical roles, because the same majors increasingly channel graduates into higher-paying jobs. Pathway effects of this kind account for 56% of the projected workforce shift over the decade, compared to 37% from major choice itself.
Unemployment among young CS graduates is at a decade high. It reached 10.9% for 22-to-24-year-old CS degree holders in 2024 — higher than at any point in the past decade, including during the pandemic. Unemployment for older CS workers barely moved. The labor market is sending a signal, and it appears in the entry-level data first.
The retreat from the humanities extends well beyond English and History. Linguistics and Foreign Languages fell 51%. Communications slid 21%. Fine Arts dropped 18%. Social Sciences contracted 14%. The shift is not just toward STEM; it is also away from a broad swath of traditional liberal arts majors.
Healthcare majors gained ground, but it is not clear if the growth will be enough. Medical and Health Sciences became the largest field outside Business, with Nursing up 28% and Community and Public Health up 143%. Projected supply of healthcare practitioners rose 9.2% over the decade. But demand has grown even faster: HRSA projects a national registered nurse shortfall of roughly 109,000 FTE by 2038, with rural areas hardest hit. Whether the major shift is closing the gap or just slowing its widening is unclear.
The teacher pipeline is narrowing from both ends. Fewer Education majors are enrolling, and Education majors are less likely than they used to be to end up in classrooms. The two effects compound. With roughly 411,000 teaching positions currently vacant or filled by underqualified teachers nationally, this is the clearest policy implication of the data.
Gender major divergence is widening even as racial gaps narrow. Men and women are choosing more distinct paths than a decade ago — most of the divergence runs through CS, where men have flooded in. Hispanic and Black students, meanwhile, have moved closer to White non-Hispanic patterns.
We draw on two data sources: American Community Survey (ACS) 1-year microdata from 2014 to 2024 to measure what students chose to study (restricting to U.S.-born bachelor's degree holders aged 22–24), and to construct a fixed major-to-occupation matrix built from employed 30–32 year-olds in 2024 to project workforce supply; and National Student Clearinghouse enrollment data through Fall 2025 for the most current signal. We use an Oaxaca-style decomposition to separate major-choice from pathway effects. Full methodology is in the appendix.
The Decade-Long Pivot
Computer Science's share of young bachelor's degree holders rose from 2.3% in 2014 to 5.6% in 2024, a 138% increase. In raw numbers: an estimated 62,000 young adults held CS degrees in 2014; 196,000 did in 2024. National Student Clearinghouse data on current students tells the same story for the period through 2024: CS bachelor's enrollment rose from 408,000 in 2015 to 660,000 in 2024.
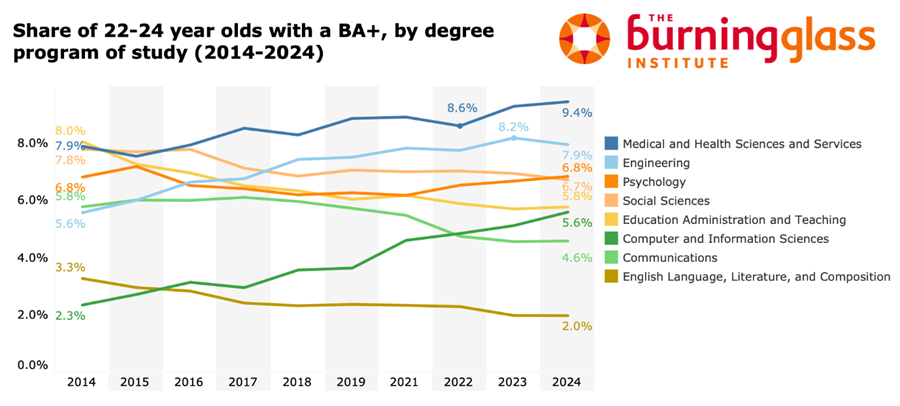
Figure 3. Share of 22–24 year-old BA+ holders by degree program, 2014–2024. Source: ACS 1-year estimates.
Engineering grew from 5.6% to 7.9%, a 43% rise. Medical and Health Sciences became the largest field outside business, surpassing Education in 2015 and reaching 9.4% by 2024. Business — the largest field throughout the decade at 17–18% of graduates — barely moved.
The declines were just as consistent. Education and Teaching dropped from 8.0% to 5.8%, a 28% decline that knocked it from second-largest major to fourth. English fell 40%. History lost nearly half its share. Linguistics and Foreign Languages declined 51%. Communications slid from 5.8% to 4.6%. Fine Arts dropped 18%. Social Sciences contracted 14%. Education alone went from producing 212,000 young graduates a year to 202,000, even as the total graduate pool grew 33%.
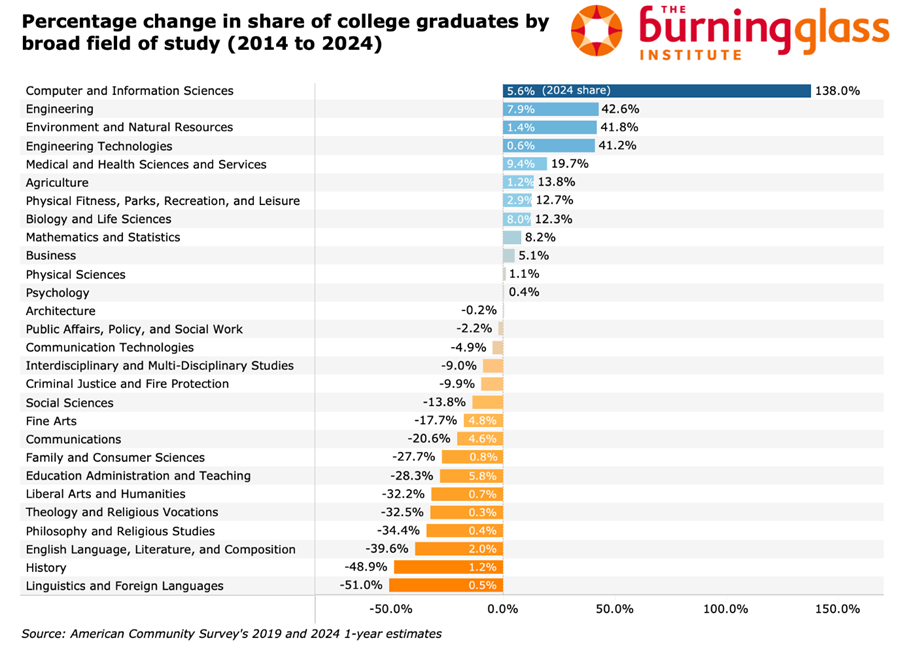
Figure 1. Percentage change in share of college graduates by broad field of study, 2014 to 2024. Source: ACS 1-year estimates.
Inside the broad categories, the patterns are sharper. The STEM surge is largely a CS and engineering story — Biology and Chemistry barely moved. Inside business degrees, Finance gained while Accounting fell. Inside health, growth concentrated in Nursing and Public Health, not in the broader Health Sciences category. Neuroscience grew 145% over the decade — the same growth rate as CS — though from a much smaller base of 0.27% of graduates.
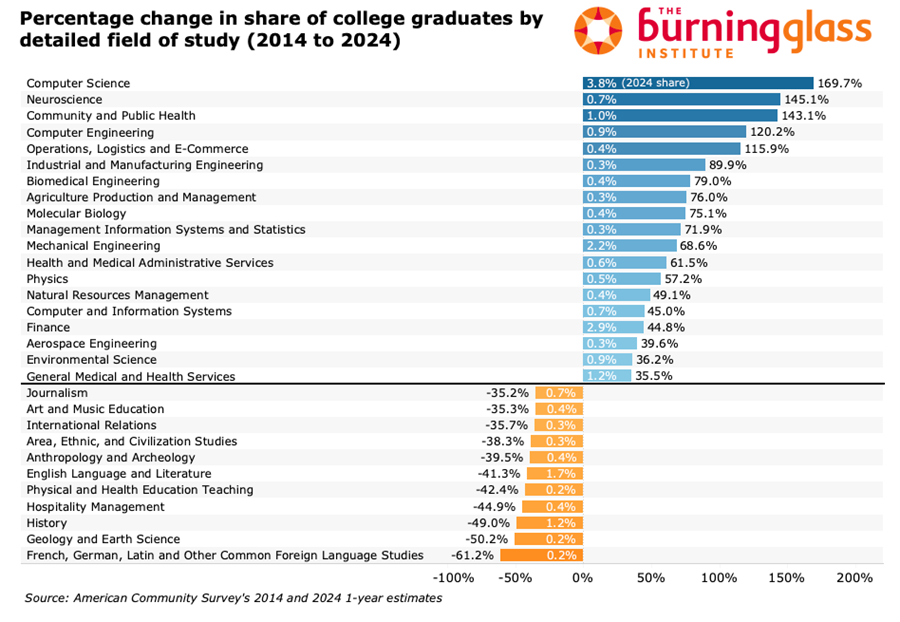
Figure 2. Percentage change in share of college graduates by detailed field of study, 2014 to 2024. Source: ACS 1-year estimates.
These are not one-year blips. The 2014–2024 time series shows CS climbing steadily, Education falling steadily, and English, History, and Communications declining consistently after 2017. Engineering grew through 2023 before slipping in 2024, a pattern we return to. Because the ACS captures recent graduates rather than current students, almost all of these trends reflect decisions made before generative AI became a mainstream concern.
Who Made These Choices
The aggregate numbers hide wide variation by sex and race. Among young male graduates, CS's share grew 3.7 percentage points between 2019 and 2024 alone, from 6.7% to 10.4% — making it the second-largest major for men, after business. Among women, CS graduates grew 178% over the decade but from a much smaller base, 0.7% to 2.1%. Engineering grew strongly for both, with larger percentage gains for women (108%, to 3.7% of female graduates) than men (+26%, to 14%).
The exit from Education was steep for both sexes but particularly for women: the female Education share fell from 11.2% in 2014 to 8.2% in 2024. Communications declined for both, more steeply for women.
The most divergent fields between men and women were Psychology and Biology. Psychology's overall share barely budged, but male Psychology graduates declined 26% to 2.7%, while female Psychology graduates grew 8.7% to 10% — making Psychology the third most popular major among women.
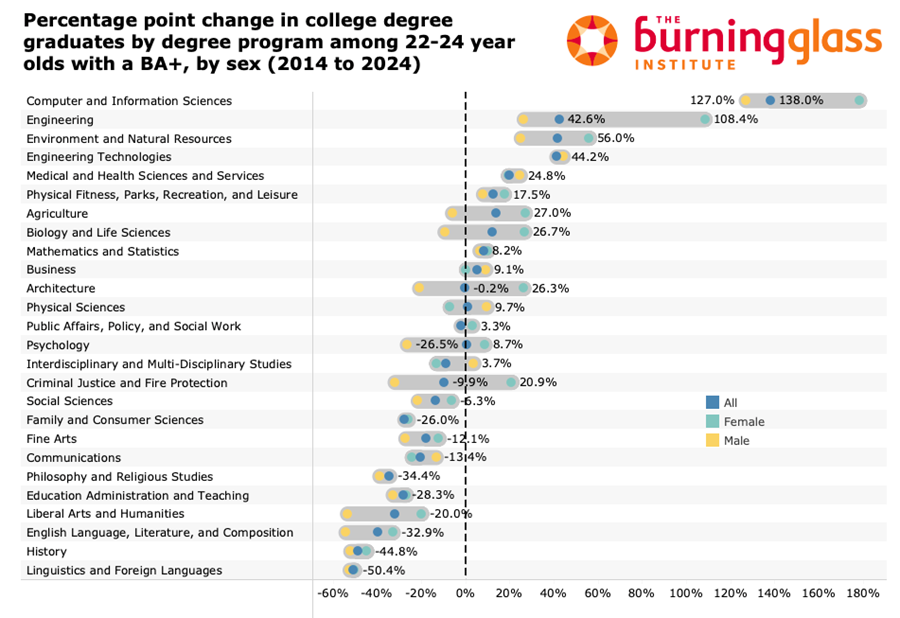
Figure 4. Percentage change in share of college graduates by degree program and sex, 2014 to 2024. Source: ACS 1-year estimates.
The racial picture is sharper. Asian students account for the single largest shift: their CS share more than quadrupled, jumping from 3.5% in 2014 to 14.4% in 2024. Hispanic students showed the largest growth in Engineering, from 3.3% to 7.4%. Black students saw the strongest growth in Medical and Biology fields, rising from 7% to 9.5% and from 5.6% to 7.9% respectively. Biology's popularity declined among Asian students, who appear to have switched into CS.
These patterns help shape which groups are moving into which parts of the labor market. CS and Engineering — the highest-earning broad fields — are growing fastest among men and Asian students. Black students are seeing stronger growth in Medical and Biology fields, which have solid earnings but lower typical pay than CS and Engineering.
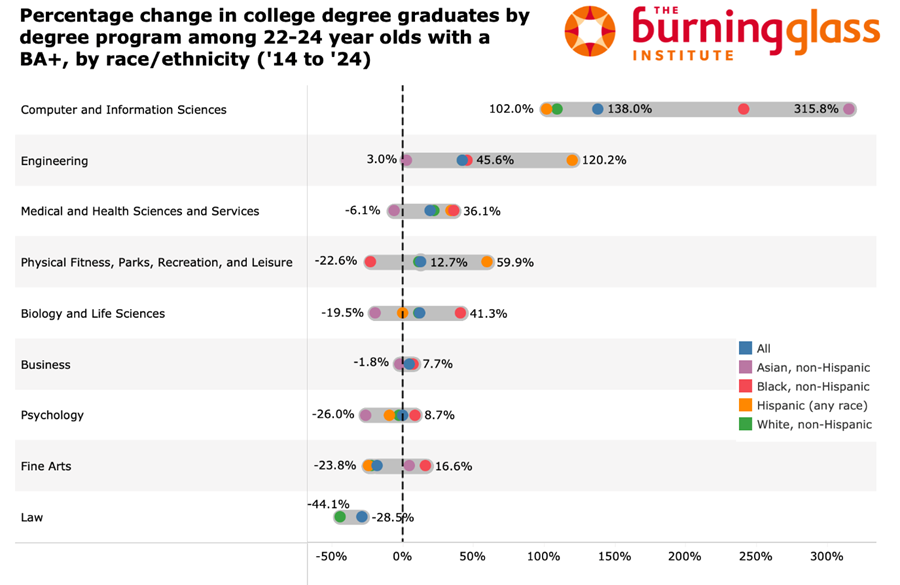
Figure 5. Percentage change in share of college graduates by degree program and race/ethnicity, 2014 to 2024. Source: ACS 1-year estimates.
Men and Women Are Choosing More Different Majors. Racial Gaps Are Narrowing.
Next, we examined the data to answer a different question: are demographic groups becoming more similar in their major choices, or more distinct? Across the decade, men and women's major distributions have grown apart. Across most racial groups, the distributions have grown together.
We measure this using a standard distance metric for probability distributions (details in the appendix). The metric runs from 0 to 1, where 0 means two groups choose majors identically and higher values mean their distributions are more different.
Between men and women, the distance grew about 16% over the decade. All of that growth came after 2019. Men flooded into CS while women's gains concentrated in Health and Psychology — fields with very different median earnings. The result is that men and women now make more distinct academic choices than they did a decade ago, and the gap is widening.
The racial picture moves in the opposite direction. Hispanic students' major distribution converged sharply on White non-Hispanic patterns, with distance falling nearly in half over the decade. Black students also moved closer to White non-Hispanic patterns, though more modestly. Asian students remain the most distinct from White non-Hispanic peers — driven by their unusually high concentration in CS — and that gap has not narrowed.
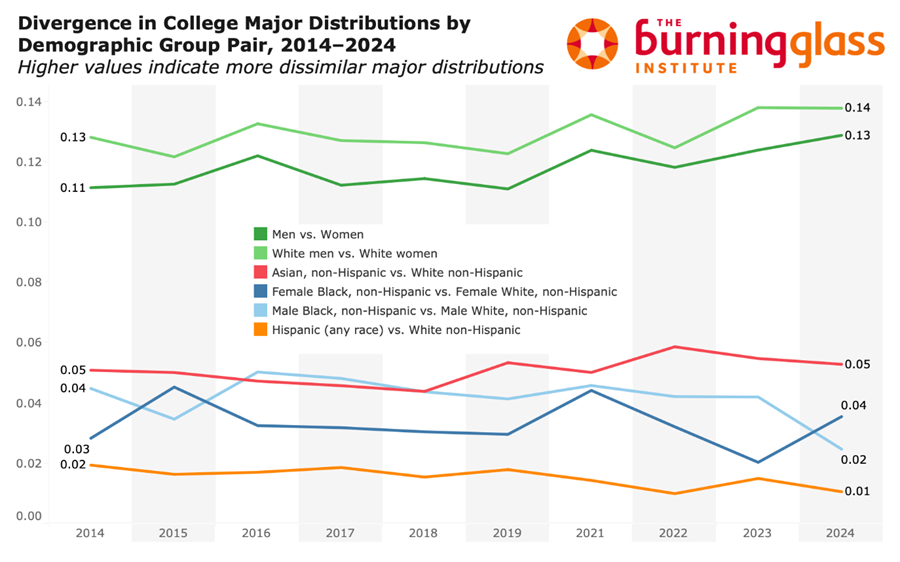
Figure 6. Divergence in major distributions by demographic group pair, 2014 to 2024. Source: ACS 1-year estimates.
Splitting by sex reveals further subgroup dynamics, the most pronounced among Black students: Black men have moved noticeably closer to White non-Hispanic men in their major choices, while Black women have moved slightly farther from White non-Hispanic women.
Two takeaways follow. First, gender appears to be the axis where major choice is fragmenting; race is the axis where it is consolidating — the reverse of what one might expect from broader public conversation about polarization. Second, because men have flooded the highest-earning and (as we will see) most AI-exposed field, the AI shock now reshaping CS may hit the male graduate cohort harder than the female one. If gender major divergence has been driven largely by CS, it may also partially reverse as CS hiring of new graduates cools. We return to this thread in the conclusion.
Following the Money — Until They Weren't
For most of the past decade, students were doing what economists would expect: enrollment grew fastest in the highest-paying fields. Engineering graduates earn a median of $100,000 by their early thirties. CS graduates earn $87,000. The fast-growing fields (CS, Computer Engineering, Mechanical Engineering, Finance) cluster in the upper-right of the chart of enrollment growth against earnings. The fast-declining fields (Education, English, History, Liberal Arts) cluster in the lower-left.
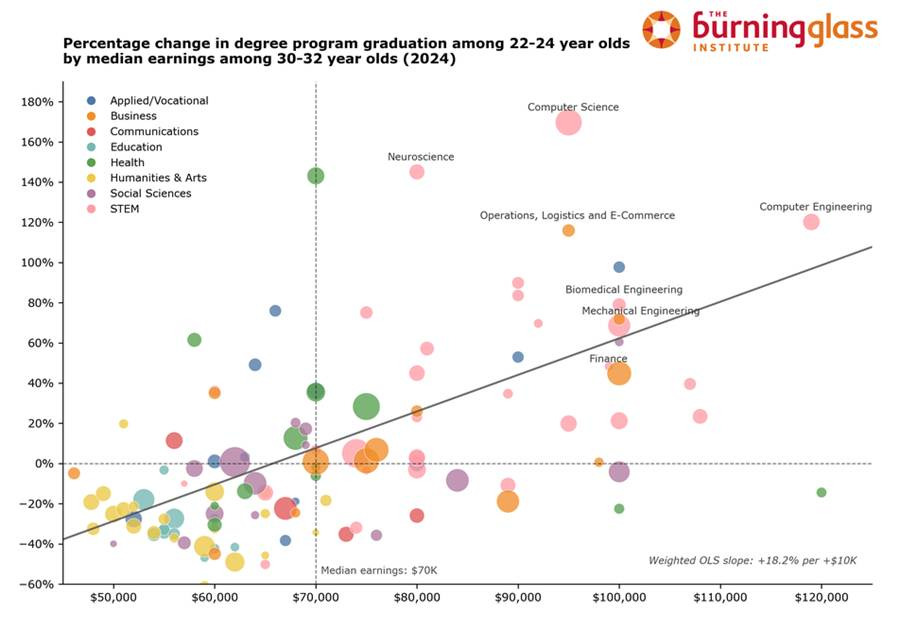
Figure 7. Percentage change in degree program graduation (2014–2024) by median earnings among 30–32 year-olds (2024). Source: ACS 1-year estimates.
Over the full decade, the data show 18.2% enrollment growth for each additional $10,000 in annual median earnings. Applying 2024 median earnings to the changing major mix is a mechanical exercise, not a forecast of realized earnings, but it suggests the compositional shift has moved the graduate pool toward fields with higher labor market returns: the implied average earnings of the graduate mix rises about $2,500 in constant 2024 dollars over the decade, a 3.5% increase from major shifts alone.
That is the headline story. The more interesting story is in the breakdown.
When we split by sex, women's major choices were substantially more responsive to earnings than men's over the full decade: 26.3% growth per $10,000 versus 17.8%. Women’s graduations from CS, Engineering, and Health programs surged. But narrow the window to 2019–2024, and responsiveness has dropped for both: 6.2% for men, 3.0% for women. Psychology remains a female outlier in both periods, growing despite a below-median $62,000.
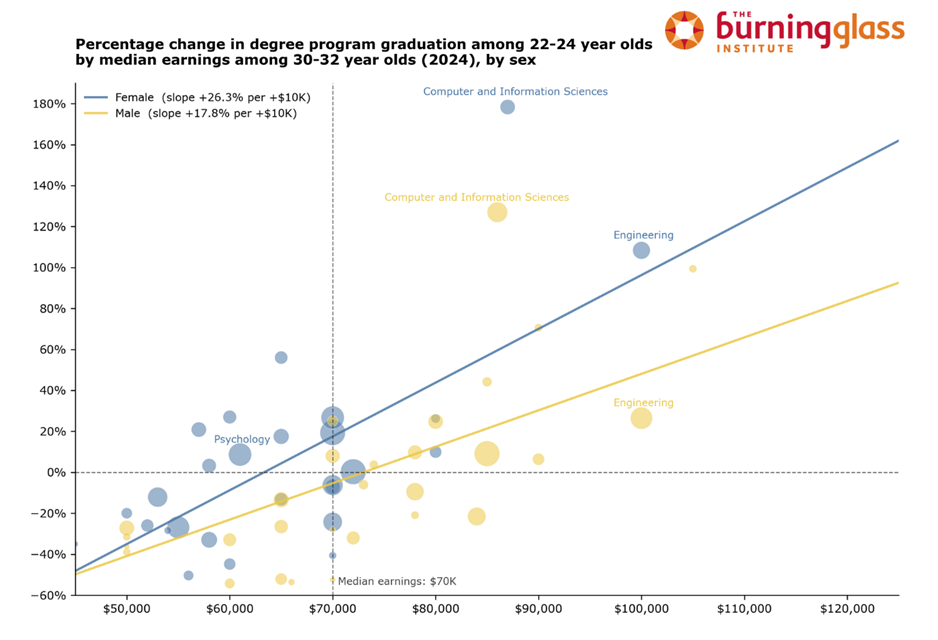
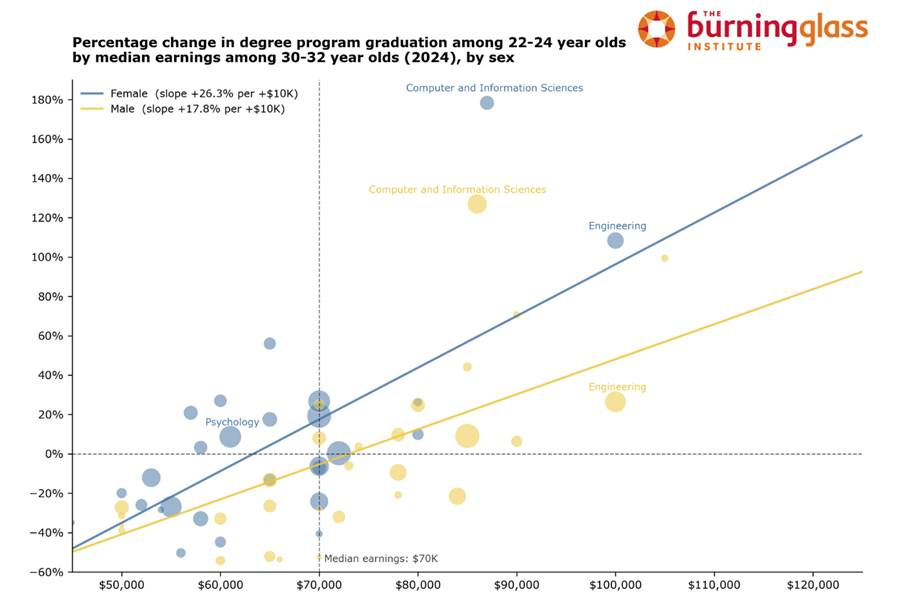
Figure 8. Percentage change in degree program graduation (2014–2024) by median earnings and sex among 30–32 year-olds (2024). Source: ACS 1-year estimates.
The racial breakdown shows the most dramatic shift, and the one that complicates the simple "following the money" narrative.
Over the full decade, Hispanic graduates' enrollment choices were the most responsive to earnings: 34.1% growth per $10,000, more than twice the rate for White graduates (16.0%). Black graduates were also more responsive (20.5%) than Asian (18.3%) or White graduates.
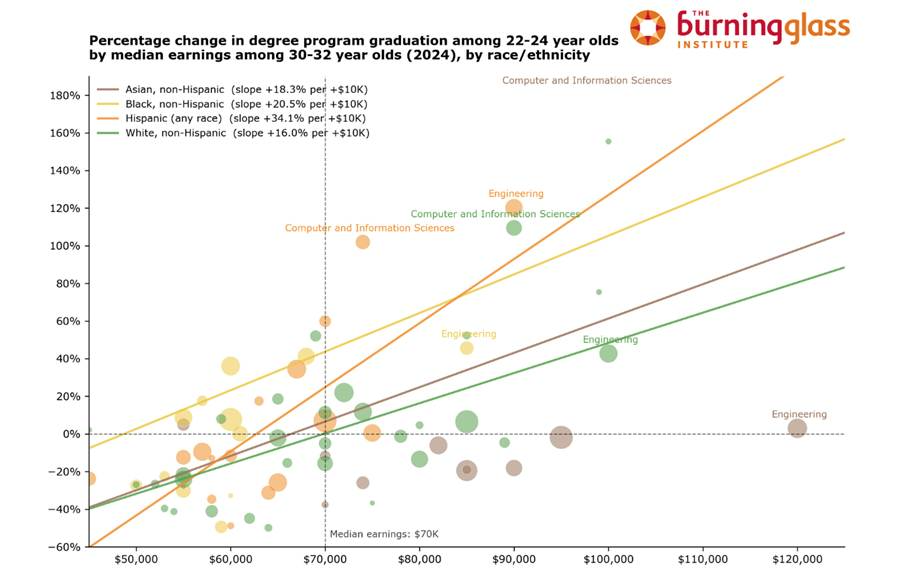
Figure 9. Percentage change in degree program graduation (2014–2024) by median earnings and race/ethnicity among 30–32 year-olds (2024). Source: ACS 1-year estimates.
When we examine just the second part of the decade, however, the responsiveness has collapsed.
Among Black graduates, earnings responsiveness fell from 14.8% per $10,000 in 2014–2019 to just 2.9% in 2019–2024 — an 80% drop. Among White graduates, it fell from 10.8% to 3.8%, a 65% drop. Among Hispanic graduates the relationship is still positive but much flatter than it was. Among Black graduates in the recent period the relationship has approached zero, and the highest-growth majors are no longer the highest-earning ones.
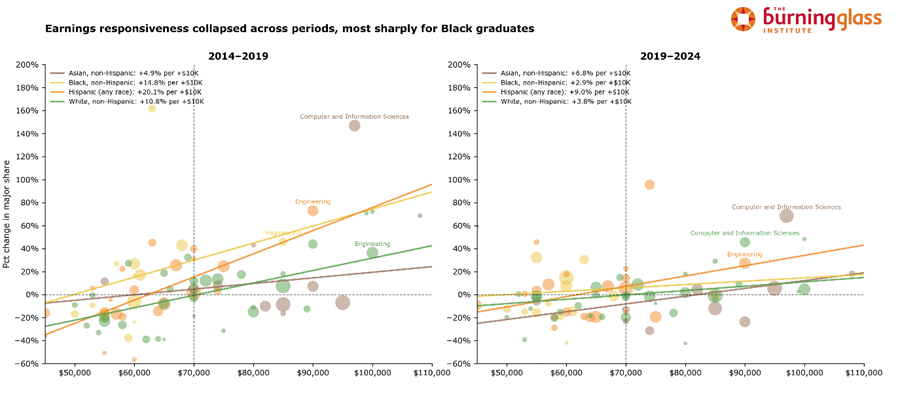
Figure 9B. Earnings responsiveness by race/ethnicity across two sub-periods: 2014–2019 (left) and 2019–2024 (right). Slopes are weighted-OLS estimates. Source: ACS 1-year estimates.
The shifts inside the Black graduate cohort are notable. Engineering's graduation share growth went from +46% in 2014–2019 to roughly zero in 2019–2024. Biology and Life Sciences saw growth fall from 43% to roughly zero. Psychology went from a –18% decline to a +32% increase. These shifts pull Black graduates toward middle-pay, higher-growth fields and weaken the high-earnings STEM pull that defined the earlier period.
Across all groups, the pattern is consistent: enrollment growth used to track earnings tightly; over the past five years, that relationship has weakened. The mechanisms cannot be identified directly from this data. Students may be receiving weaker or noisier earnings signals. Constraints or preferences may have shifted. Or the salience of AI in some highest-paying fields may already be affecting how students weigh expected returns.
For readers used to the "students chase the money" framing, this is the most surprising finding in the piece. The signal students were following has weakened, and in some groups it has flipped. We return to whether AI is part of this story. First, what these decade-long shifts mean for the workforce these students are about to join.
Whatever is driving the earnings-responsiveness collapse, the decade of choices students have already made is now feeding through into projected labor supply.
To translate major shifts into labor market terms, we construct a fixed probability matrix: for each major, we observe which occupations employed 30–32 year-olds end up in, and we apply those probabilities to the changing major distributions of younger graduates. This produces a projection of how occupational supply would shift if today's pathways from major to occupation hold constant — not a forecast of labor demand or realized employment.
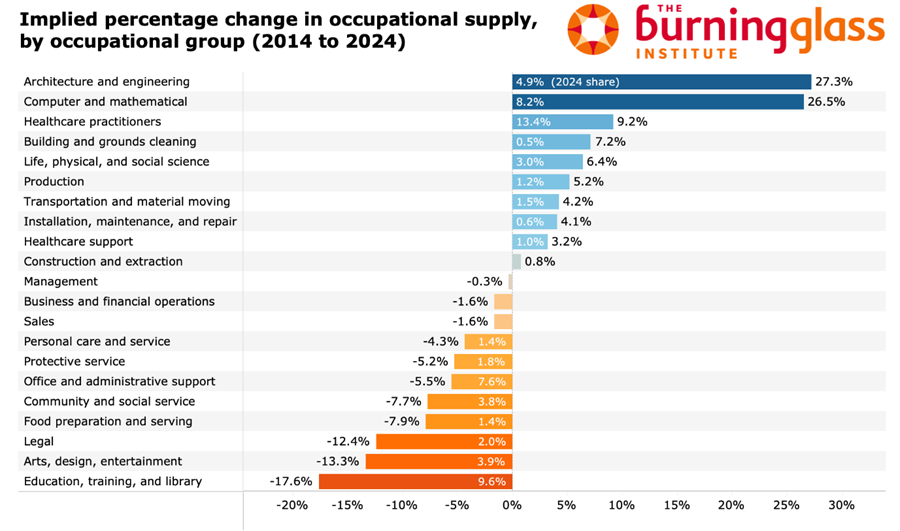
Figure 10. Implied percentage change in labor supply by occupational group, 2014 to 2024. Source: Authors' calculations using ACS 1-year estimates.
At the broad occupation group level, the largest gains are in Architecture and Engineering (+27.3%) and Computer and Mathematical occupations (+26.5%). Healthcare practitioners rose 9.2%, driven largely by nursing. Education, Training, and Library occupations saw projected supply decline 17.6% — the largest drop. Arts, Design, and Entertainment fell 13.3%. Legal occupations dropped 12.4%. Management and Business Operations, the two largest occupation groups by projected share, also saw slight declines, though as we show in the next section, this masks a large pathway effect in the opposite direction.
The detailed-occupation view sharpens the picture.
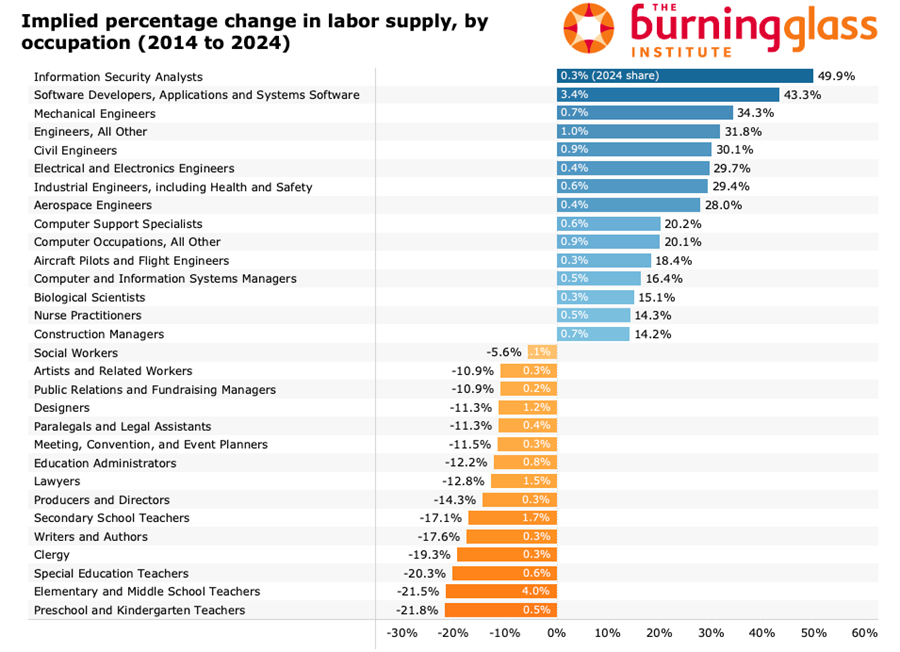
Figure 11. Implied percentage change in labor supply by detailed occupation, 2014 to 2024. Source: Authors' calculations using ACS 1-year estimates.
The largest projected gain is Software Developers, up 43.3% over the decade and rising from 2.4% to 3.4% of all projected graduates. That single-occupation increase is roughly three times the next largest. Information Security Analysts grew 49.9% from a small base. Mechanical Engineers gained 34.3%; Civil Engineers gained 30.1%. Aerospace, electrical, and industrial engineering all gained.
The declines concentrate in education and the humanities. Elementary and Middle School Teachers saw projected supply fall 21.5%. Preschool and Kindergarten Teachers fell 21.8%. Secondary School Teachers dropped 17.1%. Special Education Teachers declined 20.3%. Writers and Authors fell 17.6%. Lawyers dropped 12.8%. Designers fell 11.3%.
The teacher decline spans the full pipeline — preschool through secondary, plus special education and administration. It is consistent with the steady decline in education-related majors and points to continued strain on the future teacher workforce, conditional on today's career pathways holding constant. Because our projection holds 2024 pathways fixed by construction, this is best read as describing the shape of supply under current pathways, not as a forecast that pathways themselves will not adjust.
External evidence agrees on the direction. The Learning Policy Institute's 2025 national scan found 411,549 teaching positions vacant or filled by underqualified teachers in 2024–25 — roughly one in eight nationally. Teacher preparation program completions fell from 214,000 in 2010–11 to 160,000 in 2020–21. Public school teachers faced a 26.9% pay penalty relative to other college-educated workers in 2024.
The 11.3% decline in projected designer supply is one of few cases where reduced supply appears to align with reduced demand. The BLS projects graphic designer employment to grow just 2% from 2024 to 2034, below average, and explicitly cites AI tools as reducing demand for freelance and commercial design work. The World Economic Forum's Future of Jobs Report 2025 ranked graphic design as the 11th fastest-declining occupation globally by 2030. Students may already have read this signal: Fine Arts and Communications, the traditional design feeders, are among the fastest-declining majors.
Healthcare presents a different picture. The projected 9.2% rise in supply of healthcare practitioners is broadly aligned with documented shortages: HRSA projects a national registered nurse shortage of 108,960 FTE by 2038, including an 11% shortage in non-metropolitan areas. Nursing major growth, if it translates into actual workforce entry, would help. Geographic mismatch — most new graduates go to metro areas; shortages are most severe in rural areas and primary care — remains a structural challenge.
The Deeper Finding: Pathways Matter More Than Majors
When projected occupational supply changes, two forces are at work. Students change what they study (the "major choice" effect). And the same majors lead to different occupations than they used to (the "pathway" effect). Decomposing the change separates the two.
Pathway effects account for 56% of the total change in projected occupational distributions over 2014–2024, versus 37% for major choice (the remaining 7% is an interaction term). Over the shorter 2019–2024 period, pathway effects are even more dominant: 63% versus 32%.
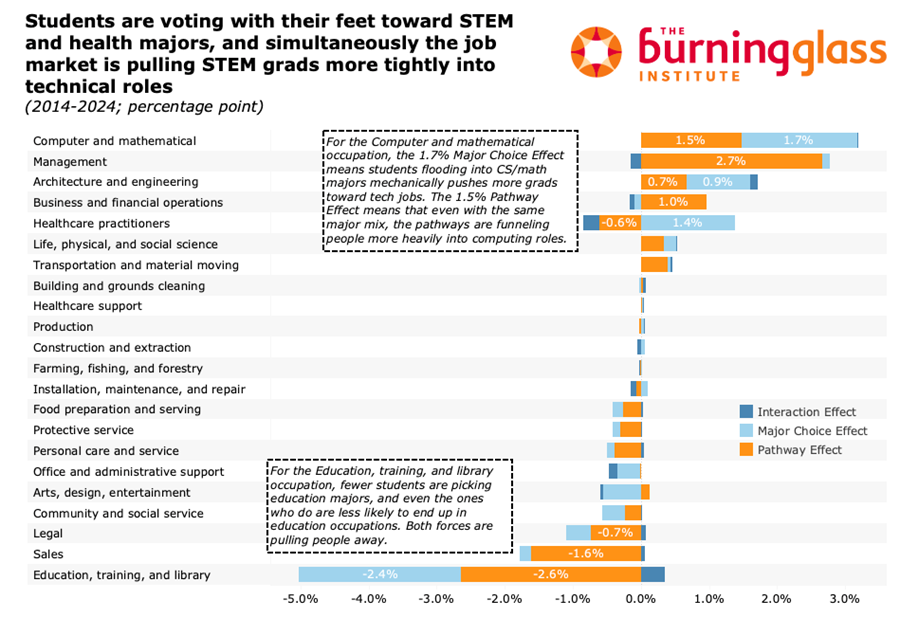
Figure 12. Oaxaca decomposition of projected occupational supply changes, 2014–2024, by broad occupation group. Source: Authors' calculations using ACS 1-year estimates.
The implication is straightforward and consequential: even if the major mix had not changed over the past decade, the projected occupational distribution would still have shifted substantially toward technical roles, because the same majors now channel graduates into different careers.
Education tells the most striking version of this story. Both forces pull supply away from teaching. 51% of the decline comes from fewer students choosing Education majors. 56% comes from Education majors being less likely to end up in teaching roles. (These sum to more than 100% because the interaction effect works in the other direction.) In the ACS, Education majors in 2024 are less likely than their 2014 counterparts to end up in teaching and more likely to work in a range of non-teaching professional and administrative occupations. The pathway from Education major to classroom has narrowed, even as the pipeline of Education majors has shrunk.
For Computer and Mathematical occupations, the split is roughly even: 53% major choice, 46% pathway. The 1.7 percentage point major choice effect comes from students shifting into CS and Math. The 1.5 percentage point pathway effect means that even with the same major mix, graduates increasingly end up in computing roles.
The reallocation operates within sectors, not just across them. Social workers and counselors draw from the same feeder majors (Psychology, Public Affairs, Criminal Justice), but counselors gained 0.4 percentage points through pathway changes while social workers lost 0.5 — a near-perfect swap reflecting post-pandemic demand for mental health counseling.
The pathway effect has a clear wage gradient. Management, tech, and business/finance occupations gained a combined 5.1 percentage points of projected supply through pathway changes alone. The three largest detailed-occupation pathway gainers are all management titles (+2.6 points combined), followed by Software Developers (+1.0 points). The pathway losers are the mirror image: elementary and middle school teachers (–2.4 points), postsecondary teachers (–1.1 points), and sales roles (–1.4 points combined).
The pattern is consistent with stronger pull toward higher-paying occupations, but the data cannot identify the mechanism — employer demand, graduate preferences, credential changes, or other factors. One important caveat: because the ACS records bachelor's degree field even for individuals with advanced degrees, some pathway shift toward tech may reflect graduates obtaining technical master's degrees rather than employers hiring bachelor's holders directly into new roles. The data cannot distinguish between these mechanisms.
Healthcare is a partial exception to the pattern. Credential requirements limit the cross-major inflow that drives positive pathway effects in management and tech; you cannot become a nurse without the relevant degree. But the pathway effect is negative. Health-major graduates who would have become registered nurses a decade ago are now more dispersed: some are upgrading to nurse practitioner and physician assistant roles, while others are moving into management, business operations, and counseling. Registered nursing alone lost 7 percentage points of health-major share over the decade. Credentials create friction, but they have not prevented a meaningful reallocation both within healthcare's hierarchy and out of clinical work.
Changes in major choice explain only part of the projected occupational reallocation. A larger share is driven by where the same majors lead. Interventions focused only on steering students into different majors would address only part of the change.
The Story May Already Be Changing
Everything to this point is based on ACS data through 2024, capturing graduates who made enrollment decisions years earlier. The National Student Clearinghouse provides a more current signal in actual enrollment counts through Fall 2025. The NSC data suggests the CS boom may have already crested.
In Fall 2025, Computer Science bachelor's enrollment fell 8.1% from the prior year, the first decline in almost a decade of uninterrupted growth. CS graduate enrollment fell 14%. Engineering moved in the opposite direction: Engineering bachelor's enrollment grew 7.3% in Fall 2025, to 681,800 students, continuing its rebound after growth resumed in 2023 and 2024.
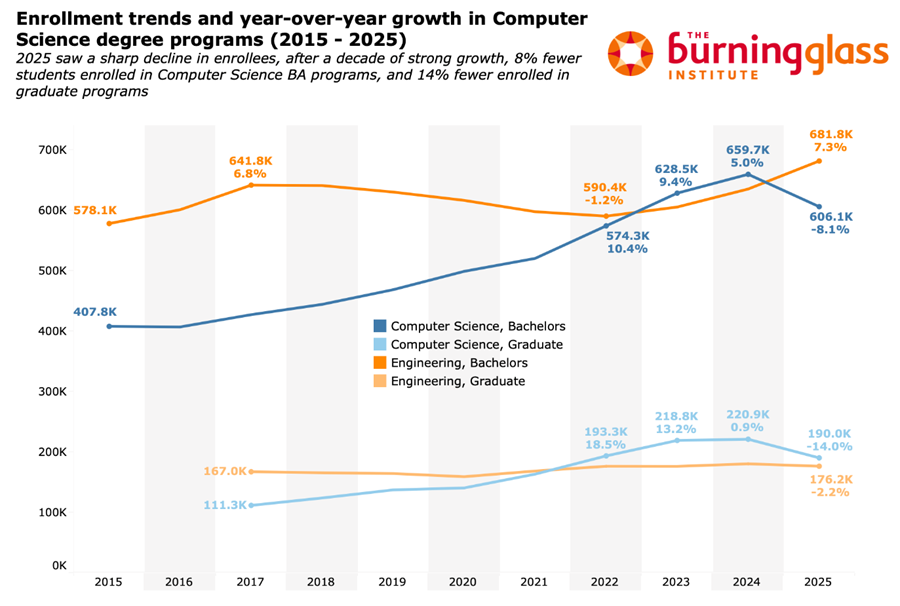
Figure 13. Enrollment trends and year-over-year growth in Computer Science and Engineering degree programs, 2015–2025. Source: Authors' calculations using National Student Clearinghouse data.
One reading of the divergence: students are shifting from software to "hard tech," perceiving physical engineering — robotics, semiconductors, infrastructure — as less exposed to AI displacement than software development. Federal industrial policy may be contributing as well, by signaling demand for physical engineering talent.
Survey data is consistent with this interpretation. In Gallup's April 2026 analysis of the Lumina Foundation-Gallup 2026 State of Higher Education Study, 42% of bachelor's degree students said AI had caused them to give at least a fair amount of thought to changing their major. 13% said they had already changed their major because of AI. Among currently enrolled students, 21% of men said they had changed majors because of AI, compared with 12% of women — a gender gap consistent with men being concentrated in the most AI-exposed fields.
A Handshake survey of 1,925 students from 521 colleges in mid-2024 found that more than 25% of CS students described themselves as "very pessimistic" about their career prospects, compared to just 6% of healthcare majors. Across all fields, 62% expressed concern about AI's impact on job prospects, up from 44% two years earlier.
When BestColleges surveyed 1,000 students in March 2024, 27% cited AI as a reason to reconsider their major, with STEM students (33%) more likely to reconsider than non-STEM students (25%). Concern about AI is most pronounced in the very fields most directly exposed to it.
Labor market data adds a third pillar. In our prior research No Country for Young Grads (Levanon et al., 2025), we found that unemployment among young bachelor's degree holders working in computer occupations nearly doubled between 2018–19 and the two years through June 2025, rising from 1.7% to 3.5%, even as unemployment for workers 45 and older in the same field barely moved. The share of entry-level openings requiring three or fewer years of experience has declined consistently in high-AI-exposure occupations since 2022, while demand for senior talent in the same roles has held steady or grown. Across information, finance, and professional services more broadly, GDP has continued to grow post-2022 while employment has flatlined. Companies are achieving productivity gains without adding headcount.
The picture sharpens when we look at unemployment by degree field — capturing everyone who holds a Computer Science degree, regardless of occupation.
Unemployment among 22-to-24-year-old CS degree holders reached 10.9% in 2024, up from 8.1% in 2022. That is higher than at any point in the past decade, including during the pandemic, and significantly higher than the rate for 22-to-24-year-old graduates across all degree programs.
Among 22-to-27 year-olds, unemployment climbed from 5.1% to 8.0% over the same period, again the highest in over a decade. Even among 25-to-34 year-olds, unemployment reached 6.6%. Among CS graduates over 35, unemployment is up just slightly and has not surpassed its pandemic peak.
(A note on sampling: these estimates are computed on ACS 1-year microdata cells of U.S.-born CS bachelor's holders, and individual point estimates for the youngest cohorts carry meaningful sampling uncertainty. The load-bearing finding is the three-year directional trend across multiple age bands moving in the same direction, not any single annual number.)
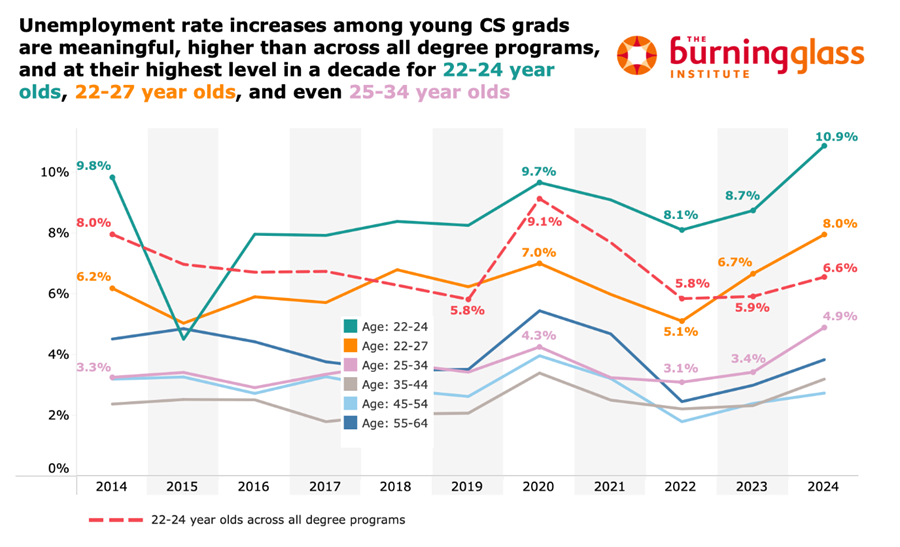
Figure 14. Unemployment rate among CS degree holders (BA+) by age group, 2014–2024, with 22–24 year-old rate across all degree programs for comparison. Source: ACS 1-year estimates.
Students reconsidering CS may be responding to labor market signals already visible in the employment data. The 2026 data will reveal whether this is a one-year blip or a durable shift. The same earnings-and-opportunity-sensitive behavior that helped drive the CS boom may now be contributing to a reassessment of it.
Methodology Appendix
Data Source
All analyses of degree field distributions, earnings, and occupational projections use IPUMS American Community Survey 1-Year microdata for the years 2014 through 2024. National Student Clearinghouse (NSC) data on enrollment trends come from the Current Term Enrollment Estimates (CTEE) reports, which provide CIP-coded enrollment counts through Fall 2025.
Population
We restrict the sample to U.S.-born individuals (birthplace codes ≤ 120, covering all U.S. states and territories) with at least a bachelor's degree (ACS EDUC ≥ 10). Foreign-born individuals are excluded because their degree field distributions reflect educational systems outside the United States and would confound the analysis of domestic student choice. These estimates therefore describe the field distributions and labor-market outcomes of U.S.-born bachelor's-and-above holders, not all college-educated adults in the United States.
Age Bands
We use two age bands for distinct purposes. Major distributions are measured among 22–24 year-olds, capturing recent graduates whose field choices reflect contemporary decision-making. The major-to-occupation crosswalk and earnings estimates are measured among 30–32 year-olds, who have had sufficient time to settle into career-relevant occupations. In sensitivity checks, the broad occupational results were stable when nearby age bands and the prior ACS year were used to construct the crosswalk; detailed occupation estimates were more sensitive.
Weights and Suppression
All estimates are weighted using the ACS person weight (PERWT). Major shares, occupational projections, earnings, and subgroup estimates are suppressed when the underlying unweighted cell size falls below 50 observations. For racial and ethnic subgroup analyses, cells with fewer than 25 unweighted observations are suppressed. This is intended to maximize coverage of smaller demographic groups while accepting modestly higher sampling uncertainty in those estimates. Readers should interpret detailed subgroup estimates for small racial/ethnic groups with particular caution.
Occupational Crosswalk
The major-to-occupation probability matrix is constructed from the 2024 ACS using employed 30–32 year-old U.S.-born BA+ holders. For each degree field, we calculate the weighted probability of employment in each OCC2010 occupation code, a harmonized classification from IPUMS. This fixed matrix is then applied to the 22–24 year-old major distributions in each year to project implied occupational supply. Because the crosswalk conditions on employment, these projections describe how the occupational composition of employed graduates would shift if 2024 career pathways held constant; they are not forecasts of labor demand or total graduate employment. OCC2010 codes are grouped into 22 broad occupation categories following the Bureau of Labor Statistics Standard Occupational Classification structure.
Oaxaca Decomposition
We decompose changes in projected occupational distributions into three components: a major choice effect (changes in the distribution of majors, holding pathways fixed), a pathway effect (changes in the major-to-occupation mapping, holding major distributions fixed), and an interaction term. Separate crosswalk matrices are estimated for the baseline and comparison years to enable this decomposition. Pathway changes reflect shifts in the observed occupational destinations of each major's graduates, which may arise from changes in employer demand, graduate preferences, or both. When we summarize the relative importance of these components across occupations, the reported shares (e.g., 56% pathway, 37% major choice, 7% interaction) are based on absolute changes summed across occupation groups.
Earnings
Median real wage and salary income (INCWAGE) is computed for employed 30–32 year-old U.S.-born BA+ holders in 2024. Aggregate wage implications are calculated by assigning each major its 2024 median earnings and computing the weighted average across the full graduate distribution for each year. This is a compositional exercise: it estimates how the earnings profile of the graduate mix would change if each major retained its 2024 earnings value, rather than estimating realized earnings in earlier years or forecasting future wages. Because INCWAGE captures wage-and-salary income rather than total personal income, it may understate earnings in fields with more self-employment, business ownership, or irregular compensation.
Degree Field
The ACS variable DEGFIELD (and its detailed version DEGFIELDD) refers to the field of the respondent's bachelor's degree, even for individuals who hold advanced degrees. This means a respondent with a BA in Biology and an MD in Medicine is classified under Biology for purposes of this analysis. This classification matters most for advanced-degree-heavy pathways such as medicine, law, and some education fields.
Jensen-Shannon Divergence Analysis.
To assess whether groups are becoming more similar or more distinct in their major choices over time, we compute the Jensen-Shannon Divergence (JSD) between pairs of major distributions. For each year, we construct the full weighted distribution of majors among 22 to 24 year-old U.S.-born BA+ holders in the ACS, using person weights (PERWT), and then compare those distributions across groups. JSD is a symmetric measure of distance between probability distributions: it equals 0 when two groups have identical major distributions and rises as their distributions become more different.
We report the divergence form of JSD, scaled to lie between 0 and 1. For race-only comparisons, the benchmark group is White non-Hispanic students. For the sex-by-race analysis, each subgroup is compared to the same-sex White non-Hispanic benchmark. We tested alternative treatments of sparse majors, including dropping low-count majors and pooling them into a residual category. These checks do not change the main directional findings, but they do show that deleting sparse majors tends to overstate divergence, especially for smaller racial groups, so the preferred specification retains the full major distribution.
NSC Enrollment
National Student Clearinghouse enrollment trends are based on CIP-coded fall enrollment counts from the CTEE reports. Year-over-year growth rates are computed from these counts. CS bachelor's and graduate programs are identified using CIP code 11 (Computer and Information Sciences); Engineering uses CIP code 14. In the enrollment charts, bachelor's and graduate counts refer to fall enrollment in bachelor's and graduate programs, respectively, as reported in the NSC CTEE appendices. Unlike the ACS analysis, which is restricted to U.S.-born individuals, NSC enrollment counts include international students, who make up a substantial share of CS and Engineering programs. Changes in international enrollment (driven by visa policy or geopolitics) may contribute to the trends reported in Section VII.
Statistical Precision
This article reports descriptive estimates from ACS microdata and does not present standard errors or formal hypothesis tests. The ACS sample is large enough that broad patterns are estimated with much greater precision than estimates for small detailed majors, demographic subgroups, or detailed occupations, which are noisier and should be interpreted as indicating direction and relative magnitude rather than precise point values.