
Labor Matters: Elite graduates are pulling back from grad school
In 2003, the best-selling career advice told ambitious college seniors to go to law school, med school, or business school within a few years of graduating. Today the share of graduates from America's most selective colleges who start graduate school within five years of finishing their bachelor's degree has dropped almost 10 percentage points — from about 51% to 41%. At less-selective schools, the rate is flat.
This is not a small shift. The top 2.5% of US colleges by admissions selectivity — Harvard, Stanford, MIT, Caltech, Princeton, Yale, Columbia, Chicago, Penn, Duke, Brown, Johns Hopkins, Cornell, Northwestern, Dartmouth, Rice, Vanderbilt, Berkeley, UCLA, and a handful of highly-selective liberal arts colleges (Williams, Amherst, Pomona, Swarthmore, Bowdoin, Claremont McKenna) — send meaningfully fewer graduates to grad school than they did a generation ago. Less-selective schools show no comparable decline.
What follows tracks the full elite graduate-school pipeline — the traditional professional tracks that are declining (law, medicine, MBA, research PhDs, plus Education and Health Master's), and the technical Master's that are partly absorbing the reallocation (CS, engineering, math/statistics, interdisciplinary).
These cuts have not been visible in standard higher-education or labor-market reporting before now. No public source links individual undergraduate institution to subsequent graduate enrollment at the scale needed to cut by selectivity and field simultaneously. The Burning Glass Institute Career History Dataset does, covering millions of US bachelor's degree holders observed from their BA through any subsequent graduate enrollment.
The headline: a 10-point drop at elite colleges
Harvard, Stanford, and the rest of the most selective US colleges send 10 percentage points fewer of their graduates to grad school within five years than they did in the early 2000s. Less-selective schools are flat or slightly up.
Grad school rate by selectivity, 2002-2005 vs 2017-2020 BA cohorts
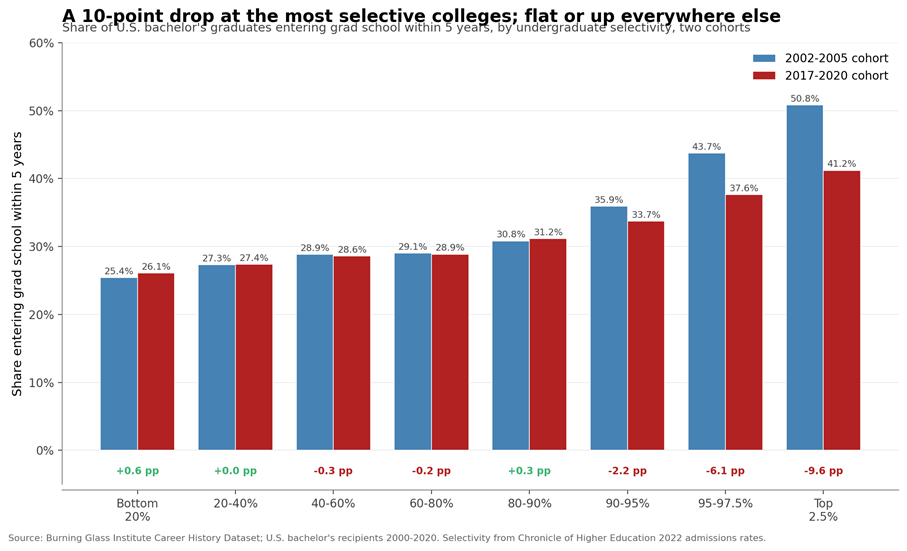
Using BGI career history data, the top 2.5% most selective colleges sent 50.8% of their 2002-2005 graduates to some form of graduate school within five years. For the 2017-2020 cohort, that rate had fallen to 41.2% — a 9.6 percentage-point drop, or a 19% relative decline. The 95-97.5% band (Michigan, NYU, USC, UNC-Chapel Hill, Boston University, Georgetown, WashU, Notre Dame, Wake Forest, Wellesley, Middlebury, and similar) showed a 6-point drop. The middle 60% of schools by selectivity are essentially flat. The bottom 20% actually ticked up slightly. The gap between the most and least selective groups has narrowed from about 25 points to 15.
The 2009 peak and the counter-cyclical story
Looking at the annual series rather than a two-cohort comparison reveals when this happened: 2009. Elite grad-school enrollment climbed through the early 2000s, peaked with the 2009 BA cohort, and has been declining since.
Annual grad school rate by BA cohort year and selectivity
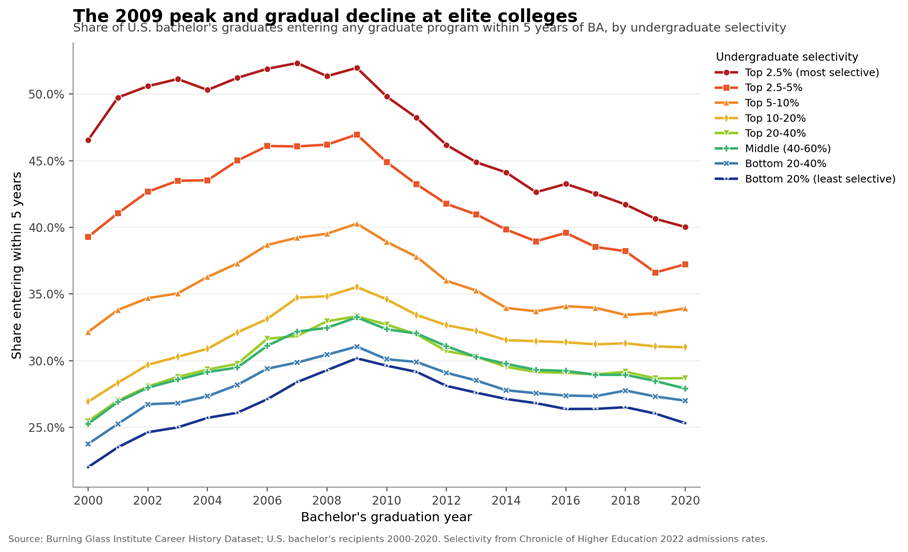
All eight selectivity groups on one chart. The 2009 BA cohort — graduates who entered the worst US labor market since the Great Depression — is the clearest inflection point at every selectivity level, though the top bands rise more steeply and then fall more steeply. A simple counter-cyclical story fits the pattern: when the labor market is weak, graduate school absorbs young people who can't find jobs. When the labor market is strong, they go to work instead. The 2009-2011 period was as weak as modern US labor markets get; the 2013-2019 period, especially in tech, consulting, and finance, was stronger.
CPS: young-BA grad-school enrollment (12- and 36-month moving averages)
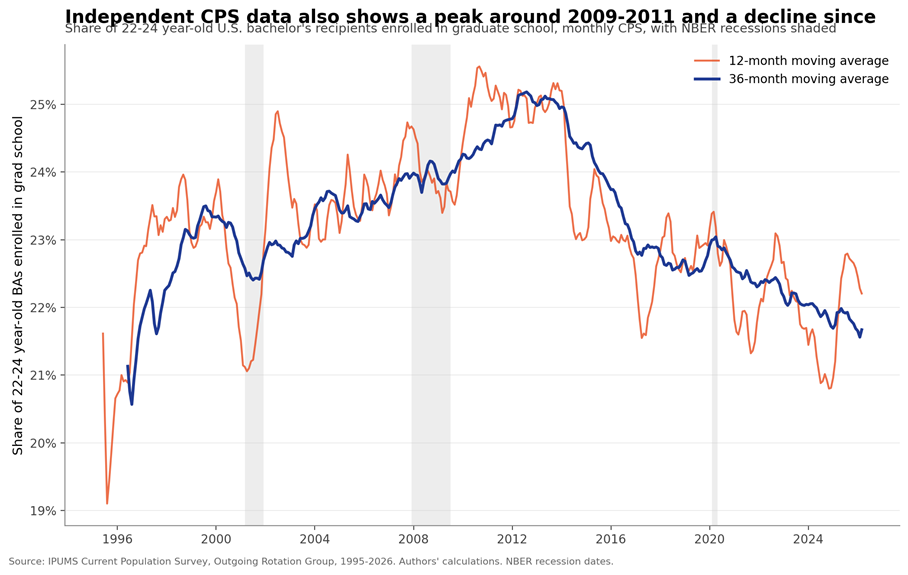
Current Population Survey data — an independent household survey, not LinkedIn-derived, immune to the data-coverage issues in our profile-based main analysis — shows young-BA graduate school enrollment peaked around 2011 at roughly 25% and has declined to about 22% by 2026. The household survey roughly confirms the 2009-2011 peak and subsequent decline seen in our main data.
Field by field: where the decline lives, and what's growing alongside it
The 9.6-point aggregate elite decline is not uniform across fields — it's the net of large declines in some pipelines partly offset by growth in others. These field-level cuts by selectivity bin are particularly novel: aggregate field trends are well-documented externally, but the elite-vs-non-elite split within each field has not previously been observable at this scale. The next set of charts walks through the field-level series, declining pipelines first (JD, MBA, research PhDs, MD, Education Master's, Health Master's, Public Admin Master's), then growing pipelines (CS, Engineering, Math/Statistics, Multi-/Interdisciplinary Master's). The story is partly reallocation, not just collapse: elite graduates are moving away from law, medicine, business, traditional doctorates, and the older Master's fields, and toward technical and quantitative Master's programs.
Law school (JD): the sharpest decline in the data
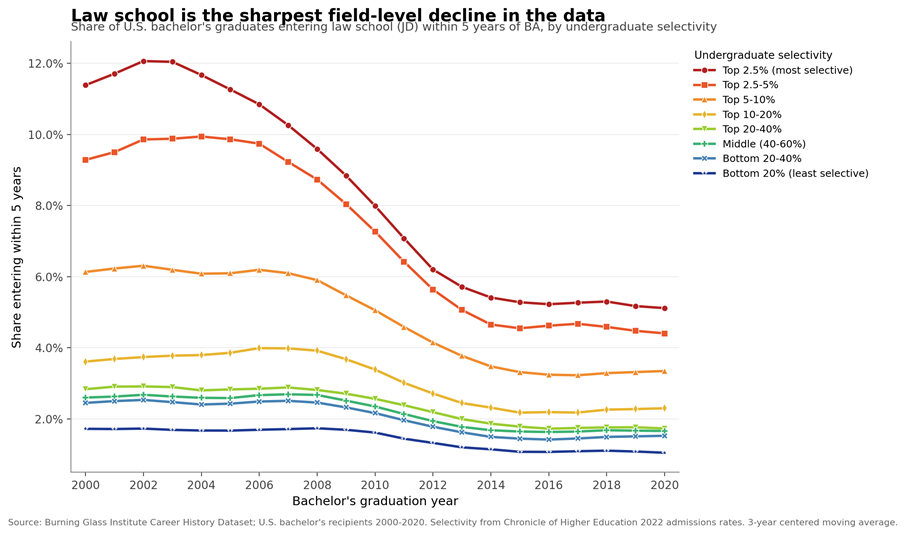
Law school enrollment at top 2.5% colleges fell from 12.4% at the 2002 cohort to 4.9% at the 2020 cohort — a 60% relative drop. The JD pipeline at elite colleges has shrunk by more than half. The decline at less-selective law-school feeders is much smaller. ABA Section 509 data confirms the directional pattern at the national level: first-year law-school enrollment fell from about 52,500 in 2010 to 37,000 in 2015, a 29% national decline. The elite-school pattern shown here is directionally consistent with the ABA national series.
MBA: peaked earlier, declined steadily
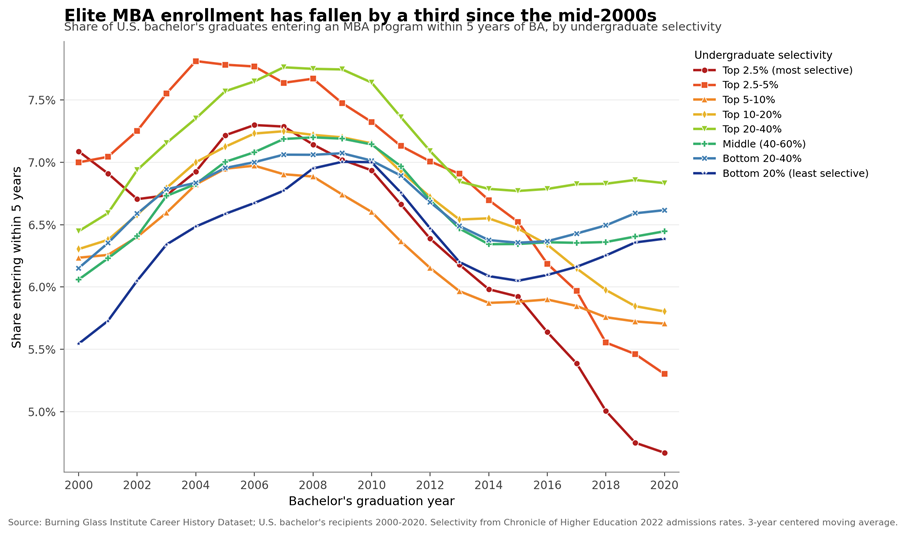
Elite MBA enrollment (direct from BA within five years) peaked in the mid-2000s around 7-8% and has fallen to under 5% by 2020, a roughly 38% relative decline. Mid and low-selectivity schools are stable or rising.
Research PhDs: declining at elite schools across STEM and non-STEM
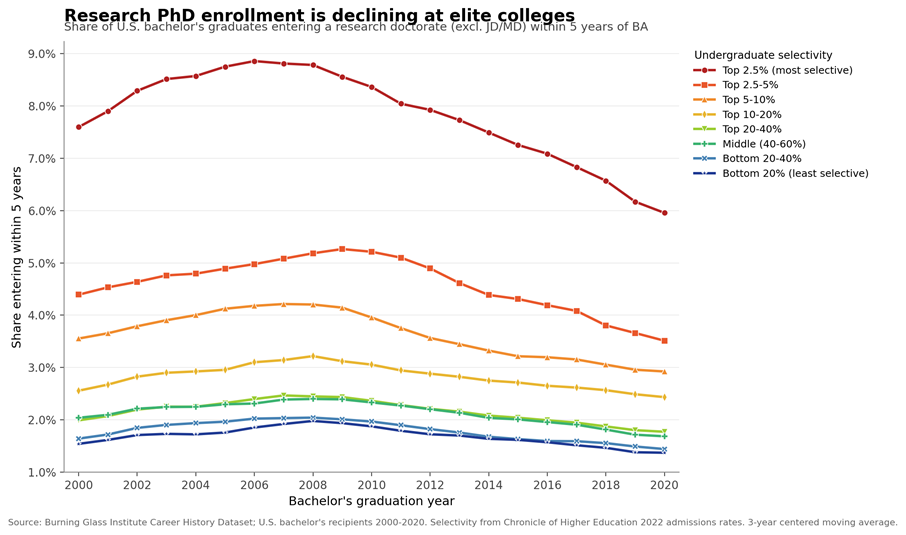
Elite research PhD rates peaked at 9.1% in 2007 and fell to 5.7% by 2020. The decline is broad-based across both STEM and non-STEM fields. Non-STEM PhDs face a well-documented weakening academic job market. STEM PhDs face rising opportunity costs — a 5-7 year PhD program now represents more foregone industry income than it did in 2005, as tech hiring of elite STEM graduates has expanded.
Medical school: rose through 2012, fell since
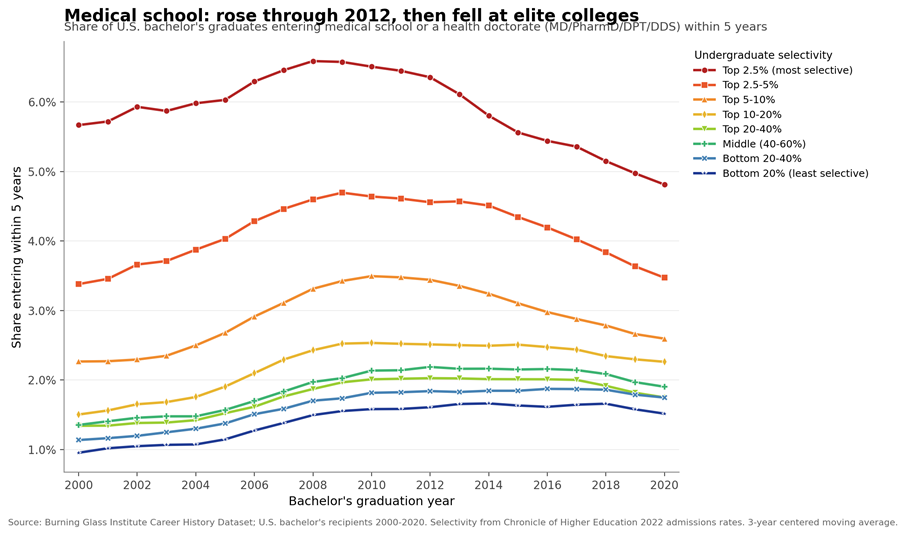
Medical school (MD plus other health doctorates like PharmD, DPT, and DDS) rose across every selectivity group through 2008-2012, then fell at elite schools from 6.5% to 4.8% by 2020.
Education Master's: a collapse at every selectivity level
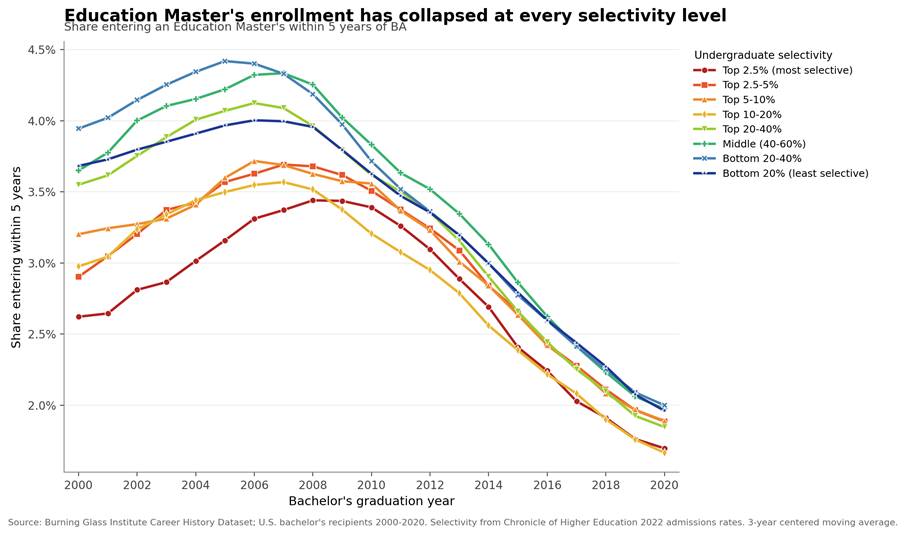
Education Master's enrollment is the single largest field-level collapse in the data. Rates nearly halved at every selectivity group between 2006 and 2020 — the uniformity across selectivity is striking and contrasts sharply with most other fields. The uniformity is itself a noteworthy finding. Most other fields in this analysis show steep elite declines or steep elite growth alongside flatness or smaller moves elsewhere; Education Master's is the only field where rates fell roughly in lockstep across the selectivity distribution. This parallels well-documented national teacher-pipeline contraction: fewer undergraduate education majors, widespread teacher supply shortages.
Health Professions Master's: surged, then declined post-2014
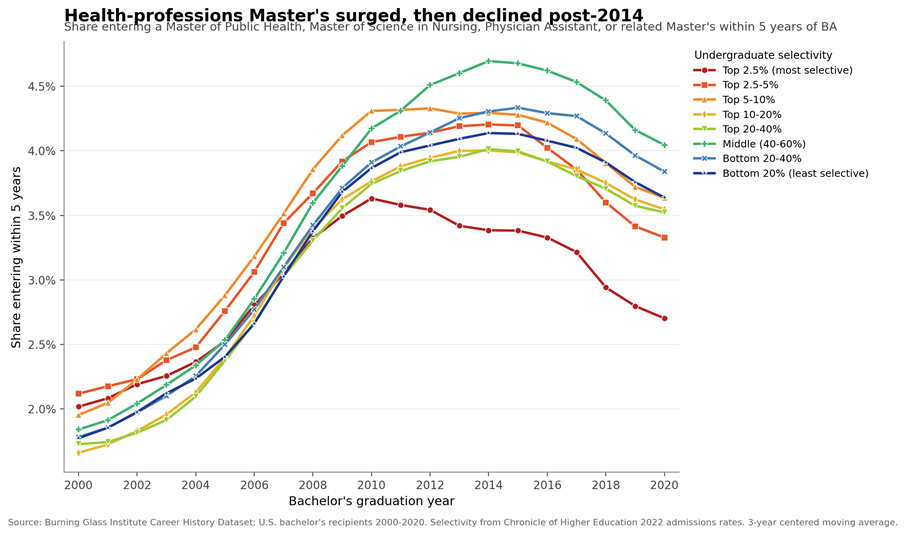
Master of Public Health, Master of Science in Nursing, Physician Assistant programs, and related health Master's surged between 2002 and 2012-2014, then fell sharply, especially at elite schools. The pre-2014 surge is well-documented.
Public Administration / Policy Master's: small and stable
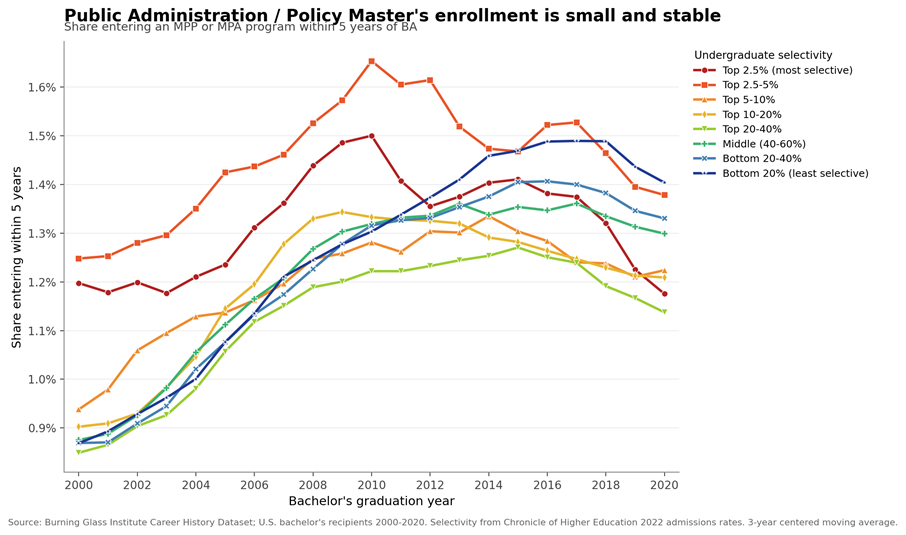
MPP and MPA programs show steady mild growth at mid-to-lower selectivity and mild declines at the most selective. Absolute rates are small (never above 1.5%). Not a major part of the overall story.
Computer Science Master's: the clearest growth story
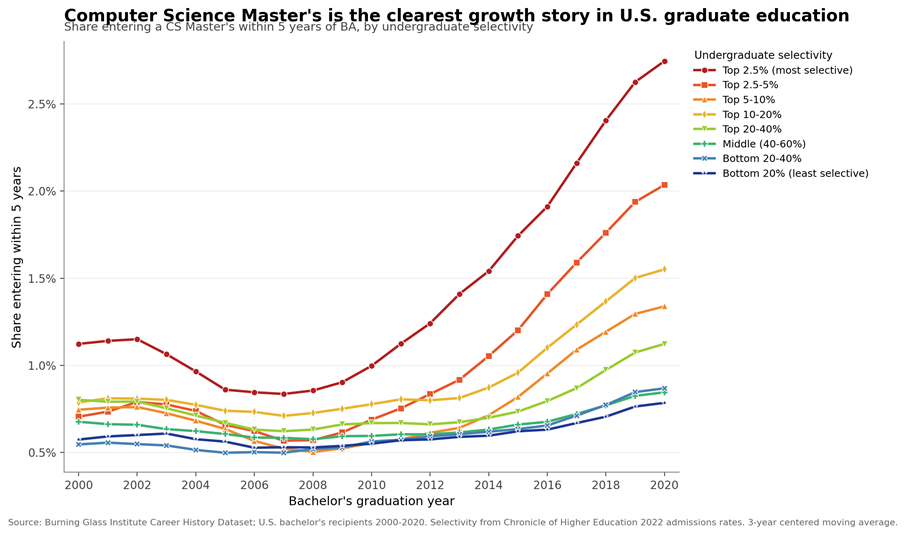
CS Master's enrollment is the clearest growth story in US graduate education. All eight selectivity groups show monotonically rising rates from roughly 2007 onward, and elite CS Master's roughly quadrupled from 0.7% to 2.8%. The impact of AI on the demand for coders may impact these trends.
Engineering Master's: modest elite growth
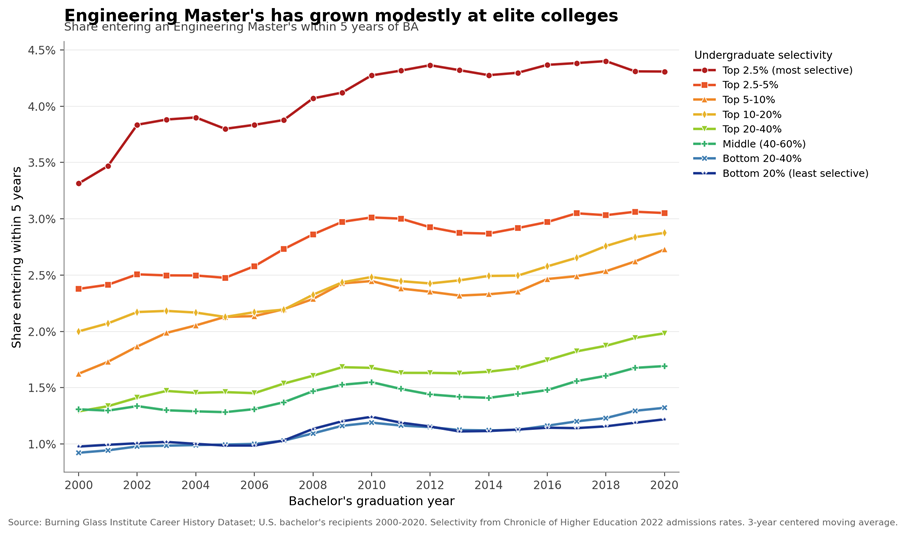
Engineering Master's has grown at elite schools (3% in 2002 to 4.3% after 2014) and stayed flat at lower-tier schools. Less dramatic than CS but directionally similar.
Math and Statistics Master's: tripled at elite schools
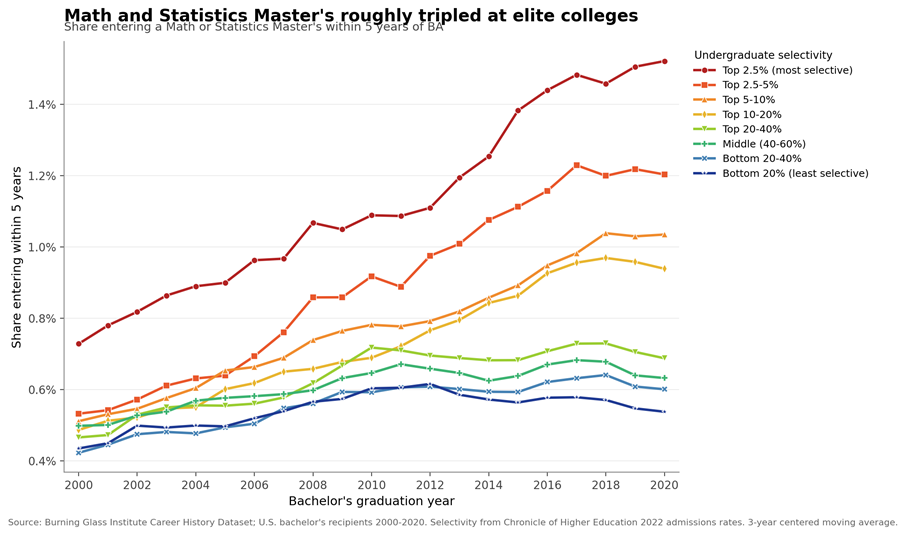
Math and Statistics Master's roughly tripled at top 2.5% schools, from 0.6% to 1.7%. Plausibly driven by quantitative finance, data science, and AI/ML demand for statistical credentialing. The absolute rates are small but the direction is unambiguous.
Multi-/Interdisciplinary Master's: quadrupled at elite schools
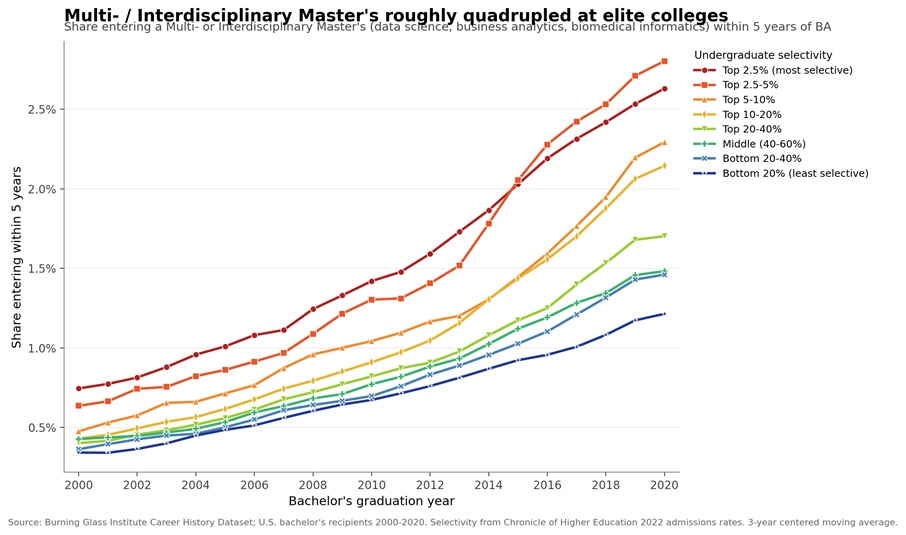
Multi-/Interdisciplinary Master's roughly quadrupled across most selectivity groups. This category captures data science, business analytics, biomedical informatics, and similar programs that cross-cut traditional fields. The broad-based rise suggests a structural shift in how Master's programs are credentialed, not just an elite-only phenomenon.
Gender: men are pulling back more than women
Men are pulling back from grad school more than women across nearly every selectivity bin and every elite professional track.
Men's decline is larger at every selectivity bin
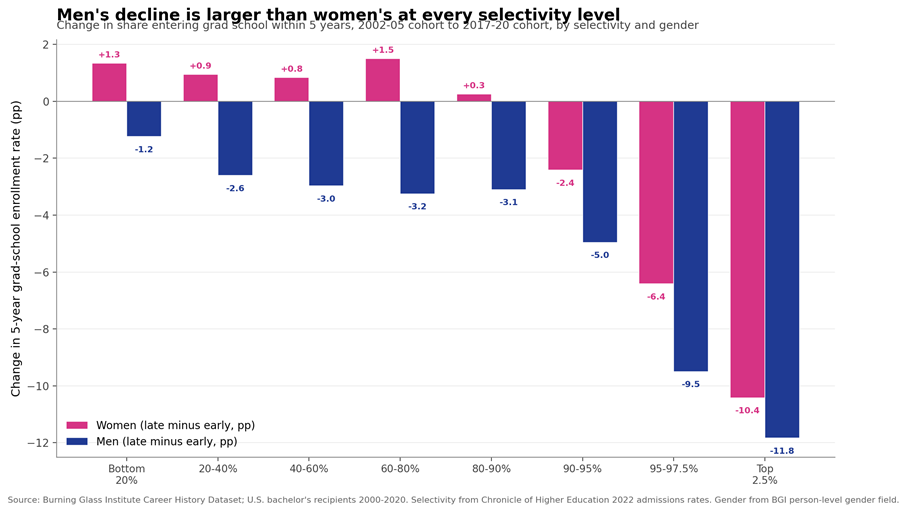
At every selectivity level, men's late-vs-early decline in 5-year grad-school enrollment is larger than women's. At the top 2.5%, men fell 11.8 points versus women's 10.4 points. At middle bands (the 20%-to-80% selectivity range), men fell 2.6-3.2 points while women actually rose 0.8-1.5 points. At the bottom 20% (least-selective schools), men fell 1.2 points while women rose 1.3 points. The gender divergence is clearest at less-selective schools, where women are actively expanding grad-school enrollment while men are pulling back. At elite schools, both genders declined substantially, but men more so. Women have consistently higher grad-school rates than men at every selectivity level, in both cohorts, by 4-6 points.
At elite schools, men's decline is larger in every professional track
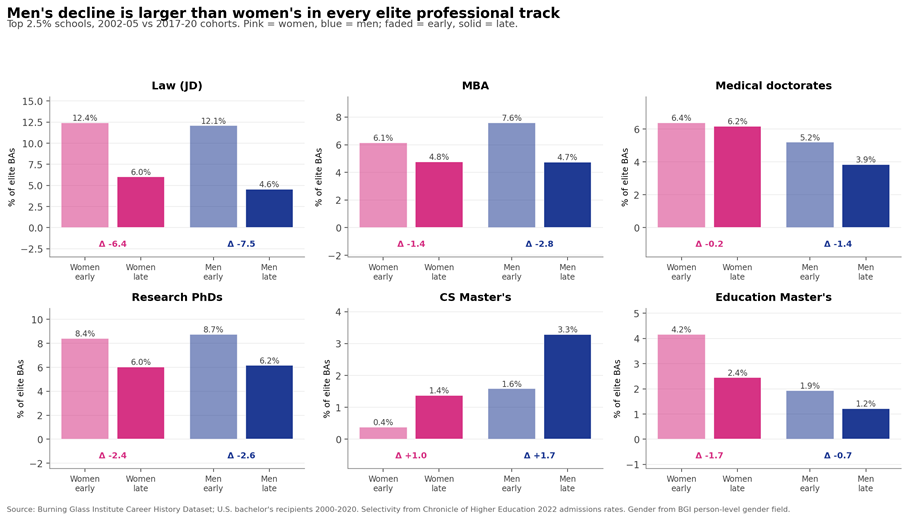
At top 2.5% schools, men's decline is larger than women's in every major professional track. For JD, men fell 7.5 points versus women's 6.4. For MBA, men fell 2.8 versus women's 1.4. For medical school, men fell 1.4 versus women's 0.2. Women's elite medical-school rate is essentially flat (6.4% to 6.2%); the elite MD decline is largely a male phenomenon.
Is this a changing-major-mix story? Mostly no.
Elite schools graduate very different mixes of majors today than they did in 2002. Computer Science grew from 4.7% to 10.4% of top-2.5% BAs; Social Sciences fell from 20.4% to 18.1%; History fell from 4.0% to 2.0%. An obvious question: how much of the headline change is just mechanical (different majors, different grad-school behavior) versus actual behavioral shifts within majors?
Decomposition: composition vs behavior at top 2.5% schools
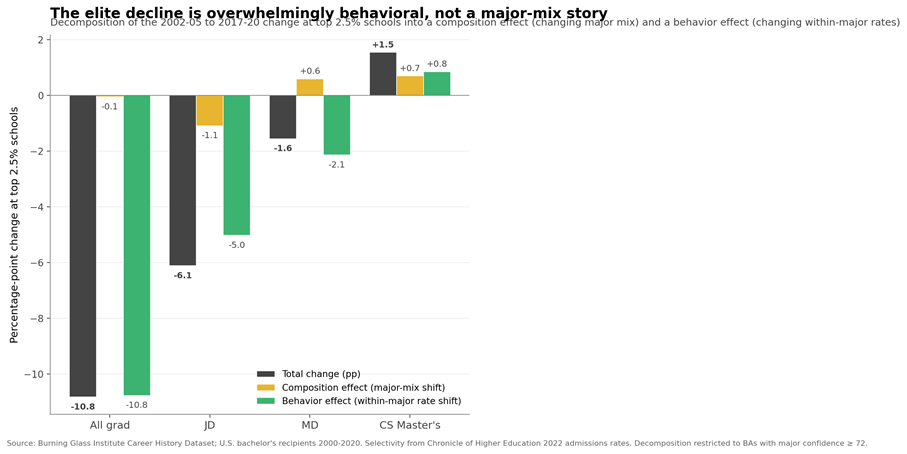
We decompose each top-2.5% change into a composition effect (holding within-major rates at late-cohort values and varying only the major mix) and a behavior effect (holding the major mix at early-cohort values and varying only within-major rates). Results are striking. The aggregate elite grad-school decline is essentially all behavior: composition contributes 0.5% of the total, behavior contributes 99.5%. Elite graduates in roughly the same majors as 20 years ago are making different choices. The JD decline at elite schools is 82% behavior, 18% composition: law school is being chosen less by the same majors that used to feed it. Medical school has an interesting pattern — within-major MD rates actually fell more than the aggregate (-2.1 pp), but the compositional shift toward more Biology and Health majors partly offset it. The CS Master's boom is roughly half-half: elite schools graduate many more CS majors AND CS majors are more likely to pursue Master's now. That's the closest thing to a pure composition story in the analysis.
But wait — isn't graduate school overall growing?
A reasonable reaction to the data above is: if elite graduates are enrolling less, and professional doctorates are contracting, then surely the share of Americans with a Master's or PhD should also be falling? Actually, no. It's still rising. This apparent contradiction is central to interpreting the headline, and it's worth walking through carefully.
(1) We measure enrollment, not completion. If someone enrolls in graduate school and drops out after a semester, they count here. Actual completion rates among those who enroll have been rising, which means the gap between enrollment and credential attainment has been widening.
(2) Education attainment measures of US residents include international students, who make up a substantial and growing share of US population with an advanced degree. This inflates national graduate-enrollment counts relative to any US-BA-only measure.
(3) The share of Americans with a bachelor's degree has been rising steadily which mechanically changes the denominator of graduate-school enrollment rates. More BAs, same number of grad-school students, lower rate — even if nothing else changes.
(4) Some people go to grad school more than 5 years after their BA. Our 5-year window misses them. The rising popularity of online and executive programs (which typically serve 3-10-year-out students) means this window is capturing less of the total graduate-credentialing behavior than it used to.
Put all of that together and you can see how two things can simultaneously be true: the share of college BAs starting grad school within 5 years is falling, AND the share of young US residents with a Master's is rising. The stock is still accumulating — it's just accumulating differently.
Validity checks — is any of this a measurement artifact?
Two concerns might be raised about the headline finding, and both were tested directly. This section is optional reading if you're persuaded by the main story; it's here for readers who want to poke at the robustness before accepting the claim.
Does the decline hold with earlier late-cohort definitions? Yes, at about 70% of the magnitude
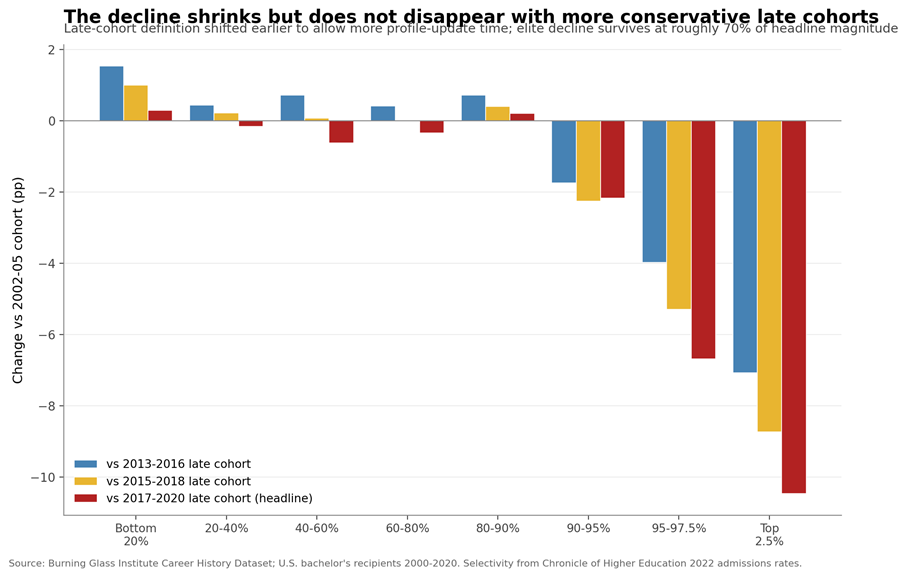
One concern: BGI profile data is self-updated (relies heavily on LinkedIn profile data). Recent graduates have had less time to add grad-school entries to their profiles, so the late cohort's grad-school rate might be systematically undercounted. To test this, we recompute the headline decline three times, each time using a more conservative late-cohort definition. The 2017-2020 late cohort (original) shows a 10.5-point decline at top 2.5% schools. Moving the late cohort back to 2015-2018 shrinks the decline to 8.7 points. Moving it all the way back to 2013-2016 — giving every late-cohort graduate at least 9 years to update their profile — shrinks it to 7.1 points. About 30% of the apparent decline is explained by profile-update lag, but roughly 70% remains even with the most conservative definition.
Does extending the window to 7 and 10 years reverse the decline? No, if anything it widens
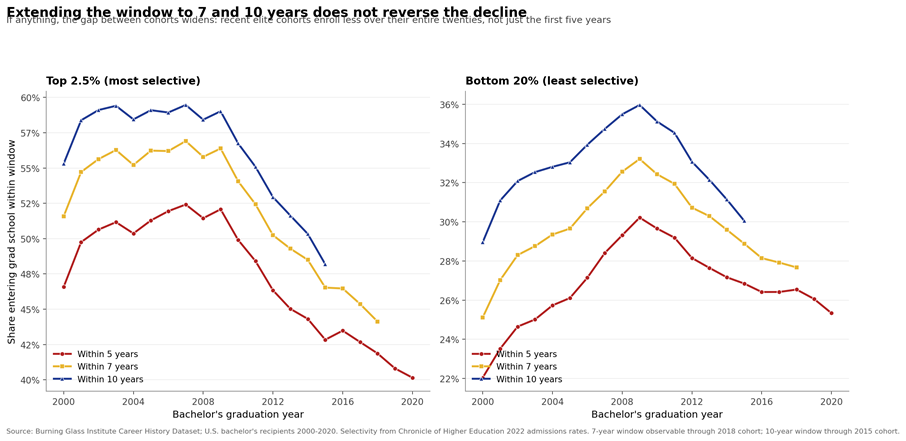
The second concern: maybe elite graduates aren't skipping grad school, they're just delaying it. Someone who used to enroll at age 24 might now enroll at 28. Our 5-year window misses them. To test this, we extend the observation window to 7 and 10 years for cohorts old enough to observe. For the 2005 BA cohort at top 2.5% schools, extending from 5 to 10 years captures an additional 8 points of enrollment. For the 2015 BA cohort, the same extension captures only 5 points. Recent elite cohorts are not enrolling later — they're enrolling less over their whole twenties. The 10-year decline is slightly larger than the 5-year decline, which rules out delay as the main explanation.
Methodology — for external readers
What we measured
The headline statistic is: among US bachelor's degree holders, what share started a graduate-level program (Master's, doctoral, or professional) within five years of their bachelor's graduation date? We measured this for two cohort groups: 2002-2005 BA graduates ("early") and 2017-2020 BA graduates ("late"). We also computed it year-by-year for BA cohorts 2000-2020 to show the time trajectory.
Importantly, "started grad school" means the profile lists a graduate degree entry with a start date within 5 years of BA end. It does not require completion. Someone who matriculated, dropped out, and never got the degree still counts. Completion rates of people who enroll have been rising over the period we study, which means the gap between 5-year enrollment and eventual credential attainment has widened.
Data source
The main analysis uses BGI (Burning Glass Institute) career history data, which is a large professional-profile dataset derived from sources including LinkedIn. For each person, we can observe their bachelor's degree (school, year, major) and any subsequent graduate degrees (type, field, start year).
Selectivity bins
Schools were matched to the Chronicle of Higher Education's 2022 admissions-rate dataset via IPEDS UNITID. Approximately 1,050 to 1,100 US undergraduate institutions matched. Each school was placed in one of eight selectivity bins based on admissions rate (bins are computed over schools, not over students, so a small liberal arts college counts equally with a large state university in defining bin boundaries).