
Labor Matters: California’s White-Collar Contraction
And What It Tells Us About the Rest of the Country
For decades, the white-collar professional economy grew in lockstep with output. More GDP meant more hiring in finance, tech, insurance, and professional services. That relationship has broken. If your company, your city, or your career depends on that sector, this data should change how you think about the next five years.
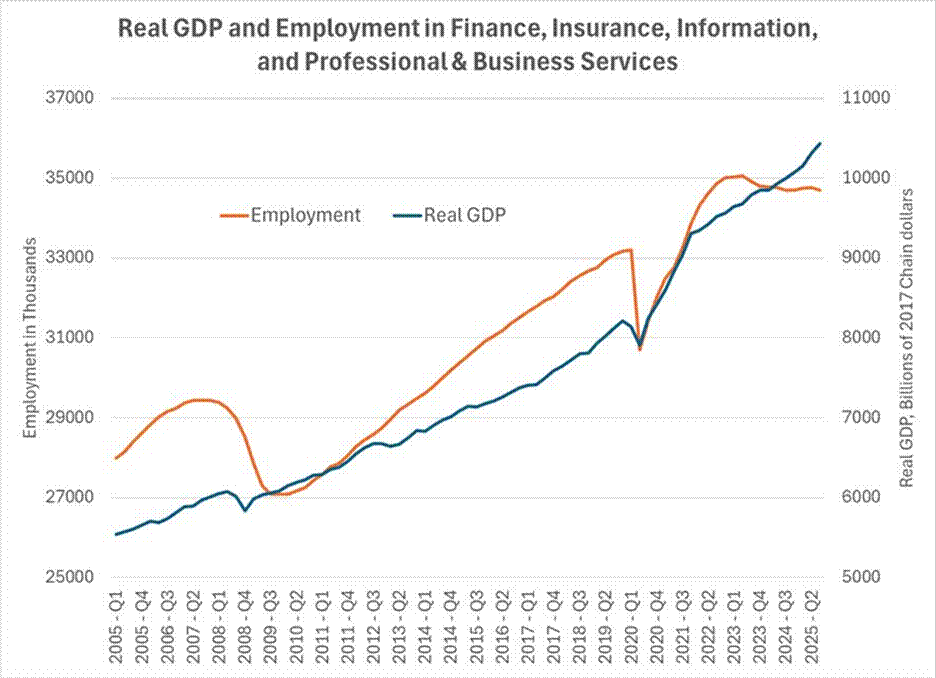
Finance, Insurance, Information, and Professional & Business Services—what I call FIIPB—accounts for more than 40% of U.S. GDP. In a recent post, I showed that since 2022, FIIPB’s real output has continued to climb while employment has flattened or declined. That decoupling is a structural break. This post digs into where the contraction is hitting hardest, starting with the state that is absorbing more damage than any other: California.
How I Measure It
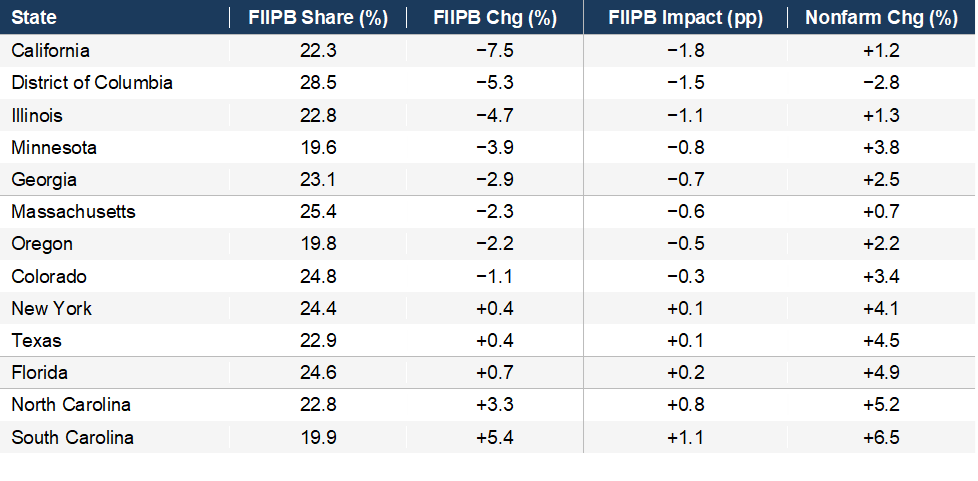
For each state and metro area, I calculate three measures: FIIPB share of total nonfarm employment (how exposed a location is), FIIPB employment change from Q4 2022 to Q4 2025 (how steep the decline), and FIIPB change as a share of total nonfarm employment (how much of total job growth or loss is attributable to FIIPB alone).
That third measure matters most. It captures the double whammy: a location gets hit hardest when it has both a high FIIPB concentration and a steep FIIPB decline. A 5% drop matters far more where FIIPB is 35% of jobs than where it is 15%. I also include total nonfarm employment change for context—some locations are growing fast enough to offset the drag, others are not.
State-Level Results
A Triple Decline No Other State Can Match
California leads the country with a −1.8 percentage point drag from FIIPB, driven by a −7.5% decline in a state where FIIPB accounts for 22% of employment. What makes California unique is not just the depth but the breadth. All three FIIPB components are declining simultaneously: Information down 14.8%, Financial Activities down 5.7%, Professional & Business Services down 6.5%. No other large state shows this triple-decline pattern.
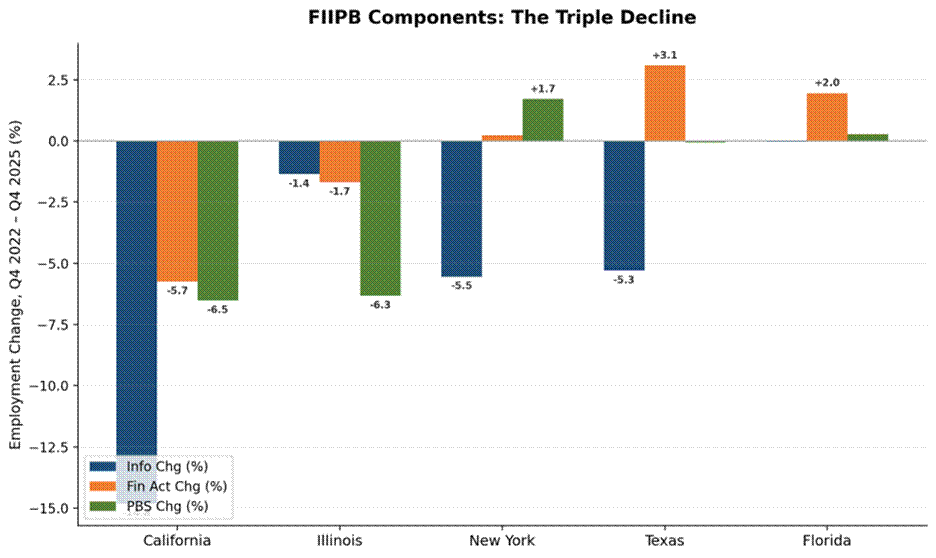
Illinois (−4.7%) comes next, but its contraction is concentrated in Professional & Business Services (−6.3%) while Information and Financial Activities declines are comparatively mild. Texas and New York each show sharp Information declines (−5.3% and −5.5%), but Financial Activities and PBS in both states are flat or growing, leaving overall FIIPB essentially unchanged.
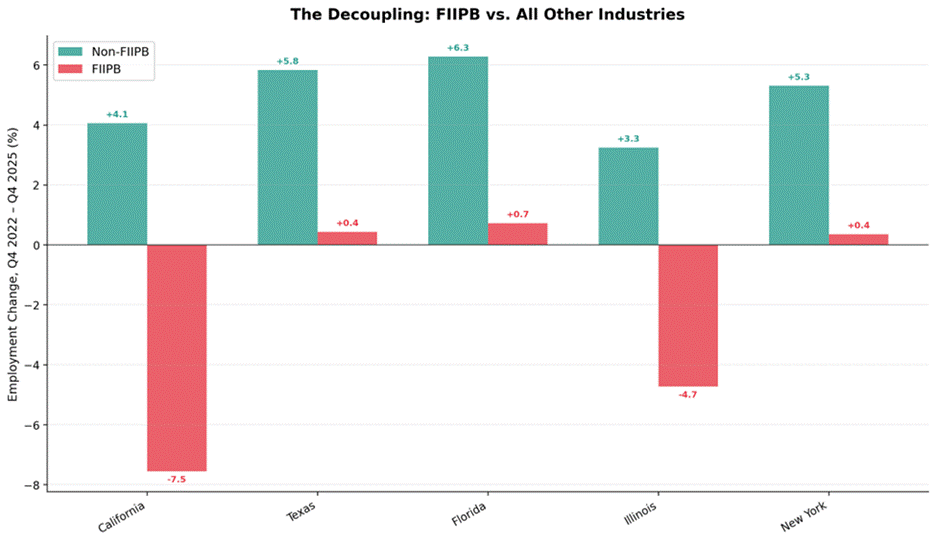
The most revealing comparison is between FIIPB and everything else. California’s non-FIIPB sectors grew 4.1%—almost exactly the national median of 4.3%. The FIIPB contraction is not a symptom of broader California economic weakness. It is a sector-specific phenomenon.
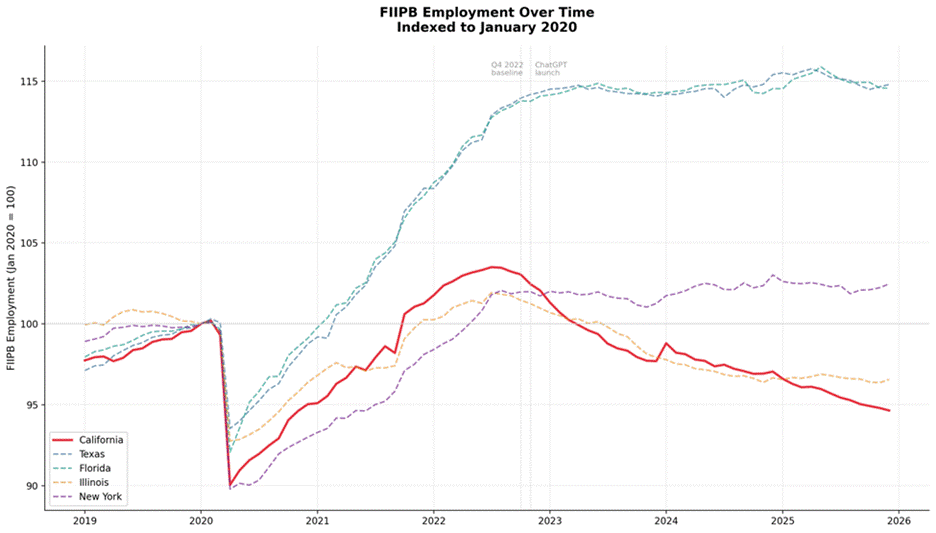
The time series sharpens the picture. California’s FIIPB employment peaked in mid-2022 and has fallen steadily since, dropping below its January 2020 level. Texas and Florida have continued climbing. The divergence accelerates after late 2022.
Every California Metro Lost FIIPB Jobs
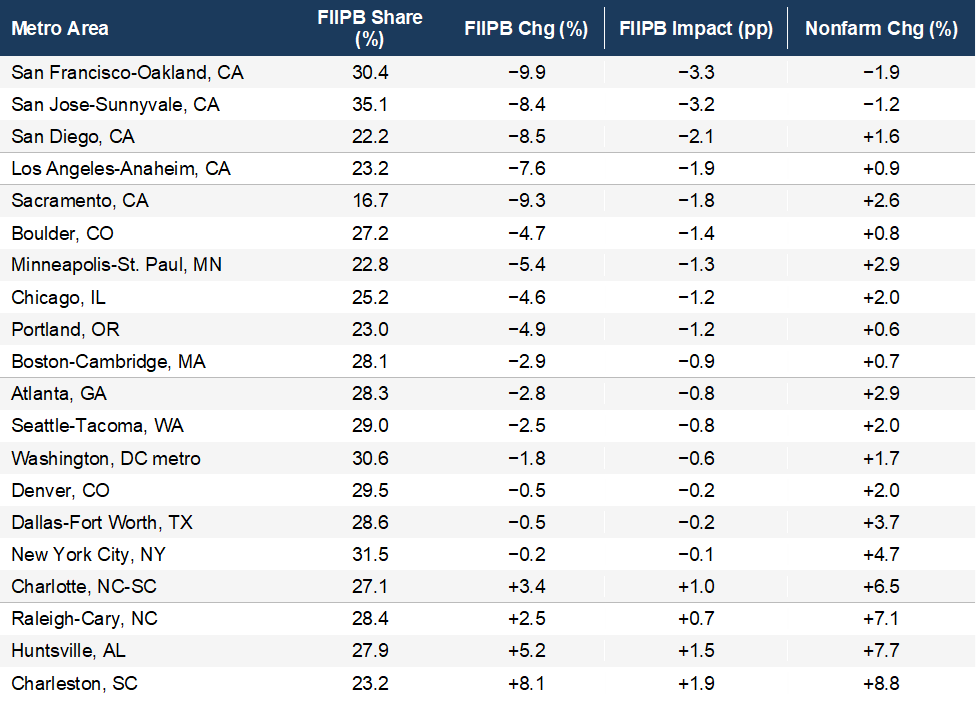
The Bay Area stands alone in severity. San Francisco-Oakland (−3.3 pp) and San Jose (−3.2 pp) combine FIIPB concentrations of 30–35% with the steepest declines in the country. The FIIPB drag alone pulled both metros into overall job losses.
But this extends well beyond the Bay Area. San Diego (−2.1 pp), Los Angeles (−1.9 pp), and Sacramento (−1.8 pp) all rank in the top tier nationally. Even smaller California metros—Fresno, Bakersfield, Stockton, Modesto—show FIIPB declines of 5–9%. The contraction spans the state’s entire FIIPB footprint.
Meanwhile, Charlotte (+1.0 pp), Raleigh (+0.7 pp), Huntsville (+1.5 pp), and Charleston (+1.9 pp) are actively gaining FIIPB employment. These metros are absorbing the professional-services activity that California is shedding.
Metro-Level Results
Why California?
Several forces are converging. No single explanation is sufficient, but together they account for the severity and the timing.
Concentration in the fastest-declining component. Nationally, Information employment has fallen more sharply than Financial Activities or PBS. California has the highest concentration of Information-sector jobs of any large state. When the component declining fastest is the one most concentrated in your economy, the impact compounds.
Earlier AI and automation adoption. The companies headquartered in California—and the professional services firms that serve them—are among the most aggressive adopters of AI tools that replace tasks previously done by knowledge workers. This does not prove AI is the sole cause of the employment decline, but the timing and the geography are consistent with an AI-adoption effect layered on top of the other forces described here.
Corporate relocations and remote-work redistribution. The Bay Area has lost a significant number of corporate headquarters on a net basis in recent years, bringing professional services, finance, and support functions with them. Astronomical housing costs and the normalization of remote work have pushed FIIPB hiring to lower-cost states. The metros gaining FIIPB employment—Charlotte, Raleigh, Huntsville, Charleston—are precisely where relocated companies and distributed teams are landing.
Post-pandemic correction. California’s tech-heavy employer base expanded headcount aggressively in 2020–2021, and the correction has been steep. This is a real factor, but it is not sufficient on its own: the decline has continued well past the point where pandemic-era additions were unwound, suggesting something more structural is at work.
The relative weight of these forces is genuinely uncertain. What is not uncertain is the outcome: California’s FIIPB employment is contracting far faster than any other large state, across all three components, in every metro area in the state.
Leading Indicator, Not Anomaly
California is an outlier today. But outliers in structural transitions often turn out to be early movers.
The evidence that this extends beyond California is already in the data. Minneapolis (−1.3 pp), Chicago (−1.2 pp), Boston (−0.9 pp), and Atlanta (−0.8 pp) are all experiencing meaningful FIIPB drags. These are not tech-dominated economies. They are diversified metro areas with large financial-services and professional-services sectors. If the contraction were a California-specific story—driven purely by tech layoffs and Bay Area relocations—these metros would be unaffected. They are not.
The decoupling between FIIPB output and FIIPB employment is not reversing. Each quarter of data widens the gap. The question for every FIIPB-heavy metro is not whether this dynamic arrives but when—and whether your economy has enough non-FIIPB growth to absorb the drag when it does.
California is showing us what full-force arrival looks like.
Read All Labor Matters Issues & Subscribe on LinkedIn