
Labor Matters: America is pulling away from Europe
The widest productivity gap in thirty years, in three charts.
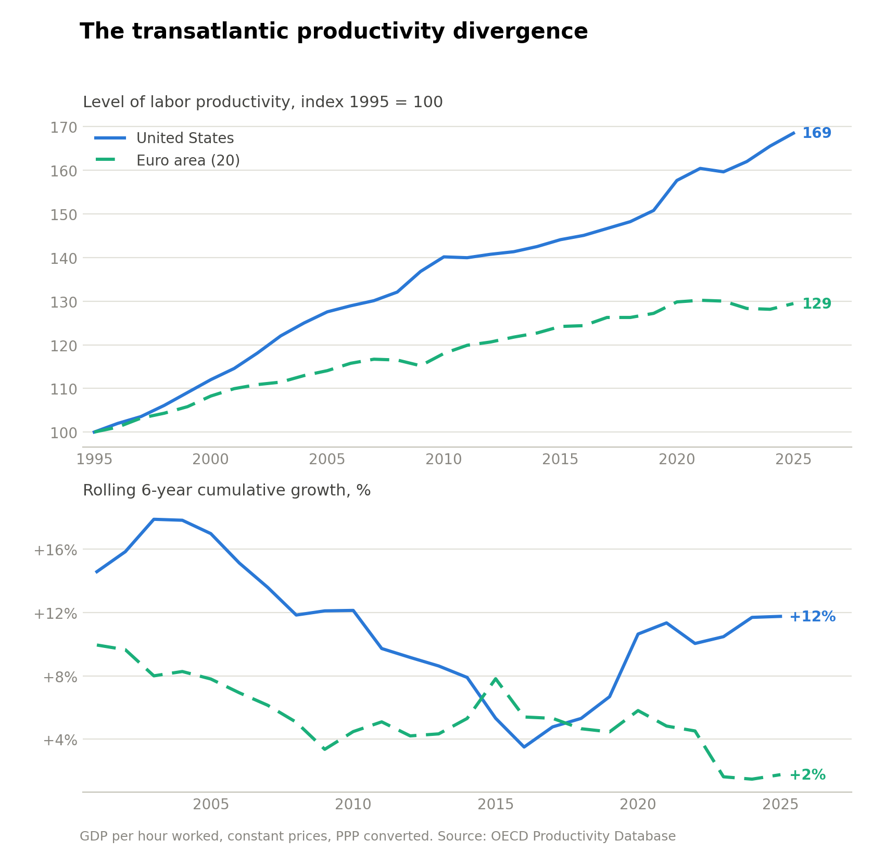
Thirty years ago the productivity gap between the US and Europe was small. Since 1995, American output per hour has grown 69%. The euro area managed 29%. And the gap is widening faster now than at any point in between.
The divergence
The top panel tells the long story. The US pulled ahead during the IT boom of the late 1990s, while Europe never turned the same technologies into productivity gains. Both economies slumped in the 2010s and the gap stopped growing. Since 2019 it has opened up again: US output per hour is up 12%, the euro area’s barely 2%, and still below its 2021 peak.
The bottom panel is why I think this moment is different. Rolling six-year growth smooths out the pandemic distortions. The US is growing at its fastest sustained pace since 2010, the euro area at its slowest on record. The distance between the lines is the widest in thirty years of data, wider than at the height of the IT boom. Back then Europe was at least growing.
No European exception
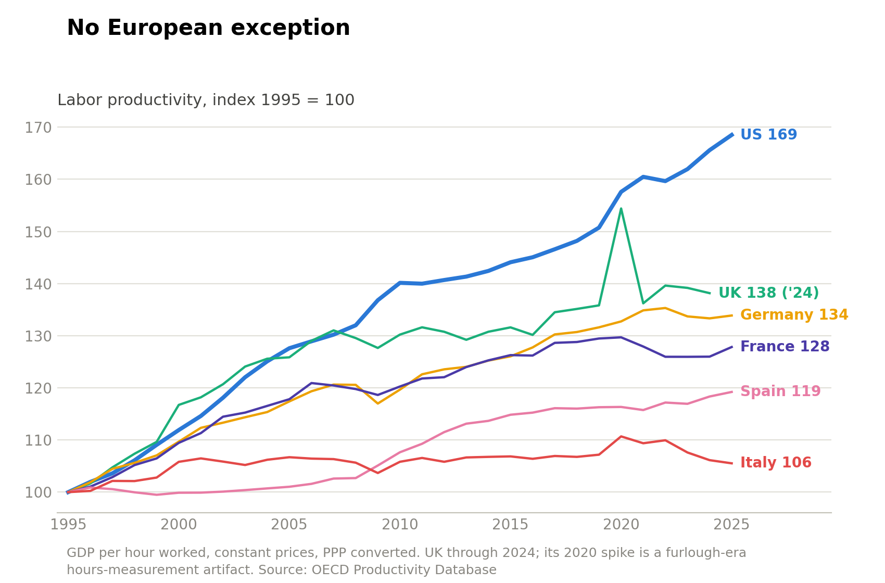
Maybe the euro-area average hides a success story. It doesn’t. Every one of the five largest European economies has stalled. Britain has done best and is still thirty index points behind the US (its data runs through 2024). Germany’s export machine has added 2% in six years. French productivity is below its 2019 level, despite cheap nuclear electricity and record employment, so neither the energy shock nor job creation explains the stall. Europe now gets jobs or productivity, one or the other; the US got both. Italy has grown 5.5% in thirty years. Not per year, in total. Export-led, state-led, services-led, in the EU and out: same result everywhere. The problem runs deeper than any one country’s policy mix.
What explains the gap?
Start with the most basic fact: America produces the technology and Europe buys it. The world’s most valuable companies (Nvidia, Microsoft, Apple, Alphabet, Amazon, Meta) are all American technology producers. Europe’s largest, SAP and ASML, are a fraction of their size. When a German firm runs on Azure it captures some of the gains from using the technology; the far larger value of producing it stays in America. In the late 1990s roughly half of America’s MFP acceleration came from inside IT production. It’s happening again: since 2019, US productivity in information industries is up 32%.
But the American surge is broad, and that’s the part Europe should find alarming, because it’s the fixable part. Since 2019 US productivity is up 28% in professional services and 23% in wholesale and retail trade, sectors both economies share. Germany’s best major sector managed 9%. French professional services fell. Same technologies, available on both continents, converted into efficiency in one and not the other, just like the internet era. The usual suspects: less intangible investment, slower reallocation from weak firms to strong ones, and a fragmented market that shrinks the payoff to any big digital investment.
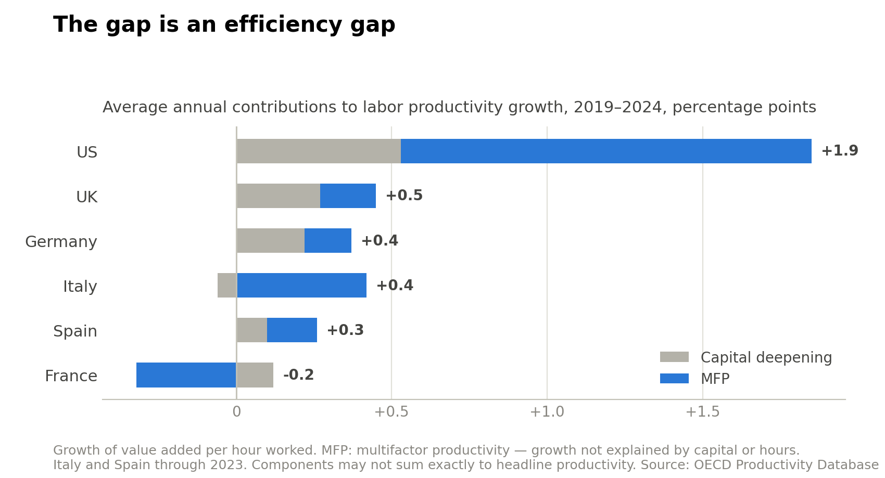
The growth accounting in the third chart sums it up. Since 2019 the US has added 1.9 points of productivity growth a year, four times the UK, its nearest pursuer. Little of it is capital deepening (workers getting more tools); most is multifactor productivity, the efficiency with which capital and labor combine. The American MFP contribution alone, 1.3 points a year, beats any European country’s total productivity growth. Germany’s MFP has nearly vanished. France’s is negative.
The counterarguments
Two objections deserve an answer. Some economists think the post-2019 surge is pandemic reallocation that will fade. The six-year window already smooths the pandemic, and the surge sits in technology-intensive sectors, not reopening ones. And Europe’s numbers are temporarily depressed by labor hoarding through the energy shock. True, mostly in Germany, and too small: it might explain the last two years, not the last thirty. These objections trim the gap at the edges. None touches the trend.
The future
· The past six years look less like an anomaly than a preview. AI is even more American than the internet was. The high-margin layers of the stack — frontier models, chips, hyperscale cloud — are overwhelmingly American; Europe’s strongest card is ASML. Market value per employee at the leading AI firms runs to tens of millions of dollars. Europe won’t capture much of it.
· Investors are betting the divergence spreads beyond tech. Eli Lilly (over $1 trillion) is worth five Novo Nordisks. JPMorgan (about $0.9 trillion) is worth more than HSBC, Santander, UBS, and BNP Paribas combined. America’s chip-and-data-center buildout, now the biggest driver of US investment growth, has no European equivalent.
· Meanwhile Asia is taking the industries Europe still leads. China’s exports are flooding Europe. Sinopec has replaced BASF as the world’s largest chemical company; BASF is shrinking Ludwigshafen while building a €10 billion complex in China. BYD became Britain’s best-selling EV brand this year despite tariffs. Volkswagen is suffering. Chinese and Korean firms already dominate batteries, solar, and shipbuilding.
· Run the last six years forward for thirty and American workers would produce roughly twice as much per hour as Europeans. Trends that long never run in straight lines. But the forces behind this one are strengthening, not fading.
· And productivity gaps become salary gaps become brain drains. US tech employers already pay senior engineers two to four times European rates. Every year the gap widens, the pull on Europe’s best people gets stronger.
Productivity is the main determinant of living standards; run these growth rates for another generation and Europe may no longer afford the social model that defines it. And the scary part: I’m not sure what could stop these trends from continuing. Can you?
Data note: Charts 1 and 2 use GDP per hour worked, constant prices, PPP-converted, through 2025 (UK: 2024). Chart 3 and the industry figures use value added per hour worked through 2024 (Italy, Spain: 2023; UK industries: 2023). The two bases can differ, most visibly for Italy, where value-added productivity rose through 2023 while GDP-based productivity fell. Market capitalizations as of late July 2026. Productivity data: OECD Productivity Database.