
Labor Matters: A Technology-Driven Productivity Regime Shift
Executive summary
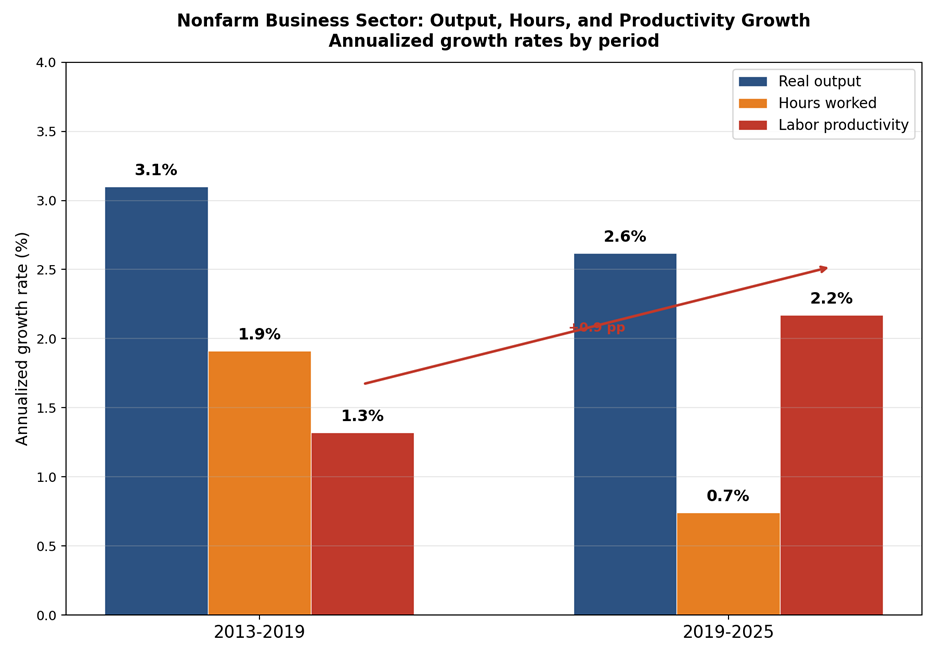
U.S. labor productivity growth has accelerated, rising from 1.3% per year in the pre-pandemic expansion (2013–2019) to 2.2% in the post-pandemic period (2019–2025). There are no signs of a slowdown in 2025, and early 2026 job growth points to continued flat employment outside healthcare and social services. The post-2019 acceleration appears overwhelmingly structural rather than cyclical.
Because BLS industry-level productivity data end in 2024 and exclude most service industries — precisely where the action is — we construct a proxy using BEA real GDP by industry through Q4 2025 and BLS hours from the Current Employment Statistics. That lets us see the 2025 acceleration and the service-sector detail that official productivity statistics miss.
The acceleration is narrowly concentrated. Three technology-exposed groups — white-collar services, retail trade, and advanced manufacturing — are posting 3.2% to 3.9% annualized productivity growth. The rest of the private economy is at 0.1%. In a standard decomposition, the contribution of white-collar services to aggregate productivity growth has roughly doubled since the pre-pandemic period, while advanced manufacturing's contribution has quadrupled from a low base. The mechanisms differ — AI and organizational redesign in white-collar services, platformization in retail, and robotics, capital deepening, and product-mix shifts in manufacturing — but the signature is the same: output rising while hours are flat or falling.
Part of this acceleration reflects one-time level shifts from the pandemic era. Marginal low-productivity firms exited. Digital tools diffused in two years that might otherwise have taken a decade. E-commerce captured a larger share of retail and held onto much of that gain. Those shifts mechanically raised average productivity and may not repeat. But they are only part of the story. The compounding forces — generative AI deployment, firm-level organizational redesign, continued platform expansion, and cloud and AI infrastructure buildout — are still in relatively early stages, and the body of this report traces them sector by sector.
This changes how to read the current economy. Weak job growth no longer necessarily signals weak output growth. When the sectors generating much of GDP growth are also producing more with fewer workers, aggregate employment growth slows even as output remains solid. That is increasingly what the U.S. economy looks like. The pressure is likely to emerge first in entry-level white-collar work, where the same industries posting the strongest productivity gains are also showing weaker demand for junior labor.
The economy is not failing to generate output. It is learning to generate more output with less labor.
The aggregate picture
Source: Bureau of Labor Statistics, Nonfarm Business Sector
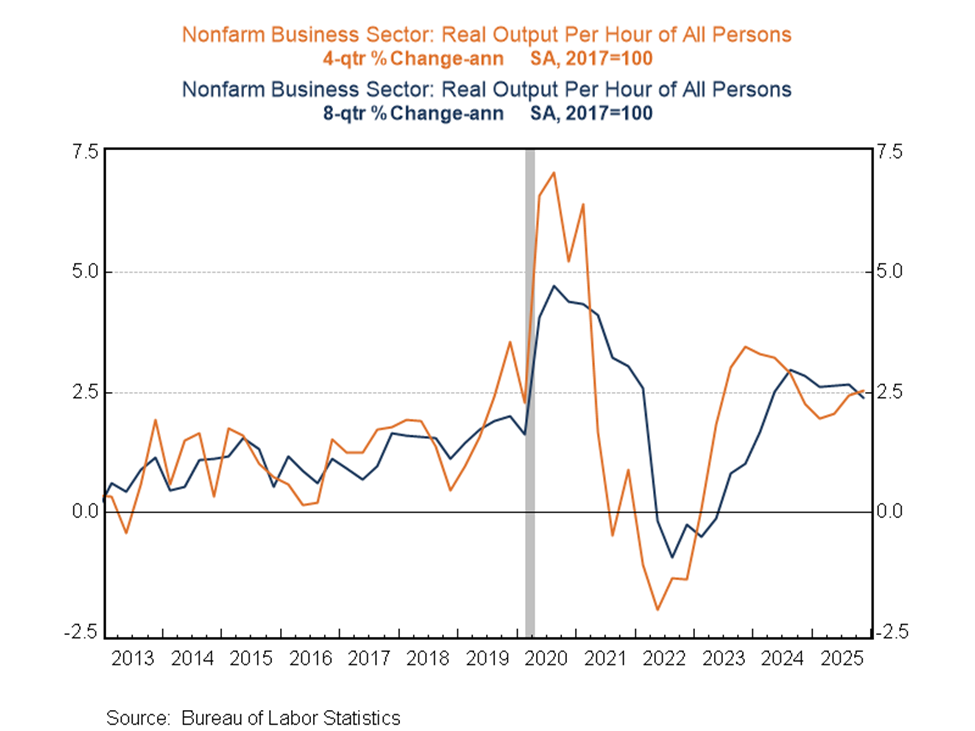
The chart above, using BLS nonfarm business sector data, shows the acceleration clearly. Output growth slowed from 3.1% to 2.6% per year. But hours growth fell from 1.9% to just 0.7%. The result: productivity growth rose from 1.3% to 2.2%. The question is where this is concentrated — and whether it reflects a durable shift in how industries convert labor into output.
BLS publishes productivity by detailed industry, but only through 2024, and its coverage of service industries — where much of the action appears to be — is limited. To look beneath the aggregate with more current and more complete data, we constructed an industry-level productivity dataset using BEA real GDP by industry (through Q4 2025) and BLS hours from the Current Employment Statistics.
The divergence is wide and getting wider
Source: BEA GDP by Industry, BLS Current Employment Statistics
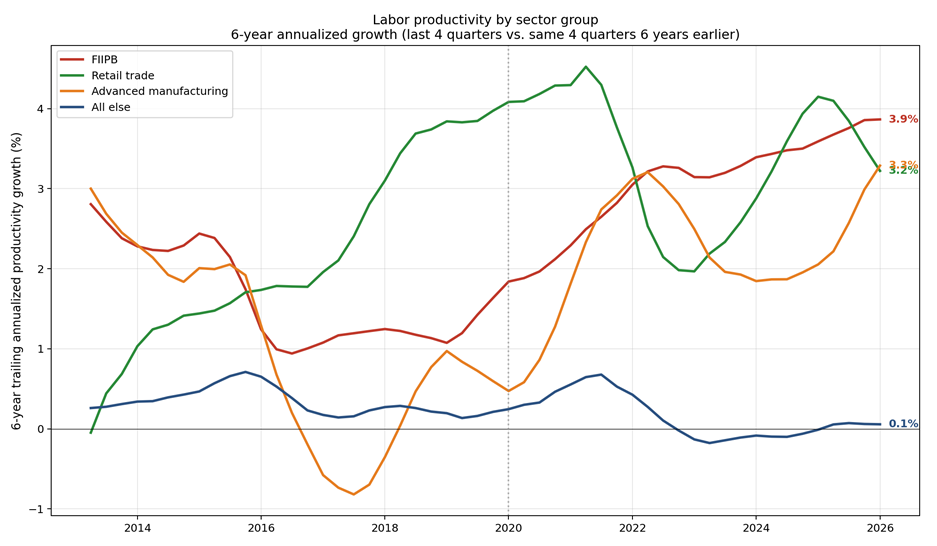
Over the trailing six years, annualized labor productivity growth in three technology-exposed groups — FIIPB (finance, insurance, information, and professional and business services), retail trade, and advanced manufacturing — ranges from 3.2% to 3.9%. Everything else — mining, construction, wholesale, transportation, utilities, education and health, leisure, and lower-tech manufacturing — is at 0.1%. That gap, roughly 3 percentage points, is the widest in our series and has widened almost continuously since 2018.
Recent momentum is even more concentrated
Source: BEA GDP by Industry, BLS Current Employment Statistics
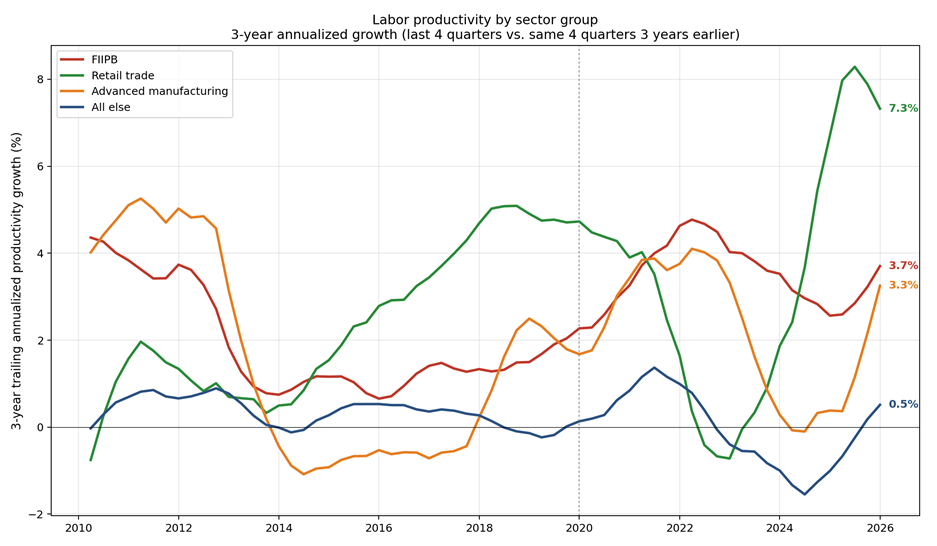
The three-year window captures current momentum. Retail trade has surged to 7.3% — the highest of any group — while FIIPB runs at 3.7% and advanced manufacturing at 3.3%. As recently as 2023, retail’s three-year trailing growth was negative. The swing since then is one of the most striking patterns in the data. “All else” remains near zero.
Each sector’s contribution to aggregate growth
Source: BEA GDP by Industry, BLS Current Employment Statistics
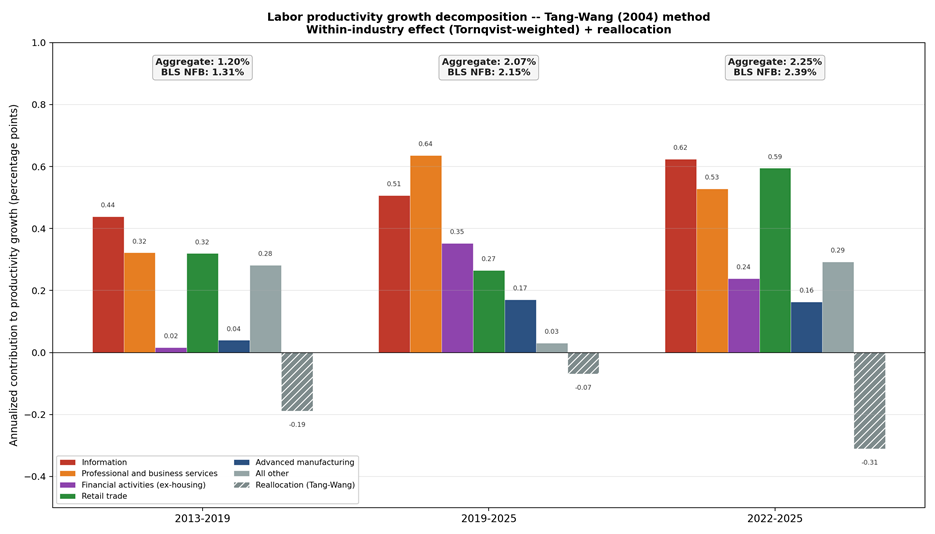
A standard decomposition framework quantifies each sector’s contribution to aggregate private-sector productivity growth. FIIPB’s combined within-industry contribution roughly doubled between 2013–2019 and 2019–2025, from 0.78 to 1.50 percentage points per year. Advanced manufacturing quadrupled from a low base. Retail trade’s contribution held steady in the six-year view but spiked in the most recent three-year window. The rest of the economy declined from 0.28 pp to near zero.
The hatched bar represents the reallocation effect — the impact of hours shifting between industries with different productivity levels. It has been consistently negative, meaning hours have been moving toward lower-productivity sectors (notably education and health care), partially offsetting the within-industry gains. The within-industry productivity improvements in technology-exposed sectors are even larger than the aggregate numbers suggest.
White-collar services: the largest piece of the story
Source: BEA GDP by Industry, BLS Current Employment Statistics
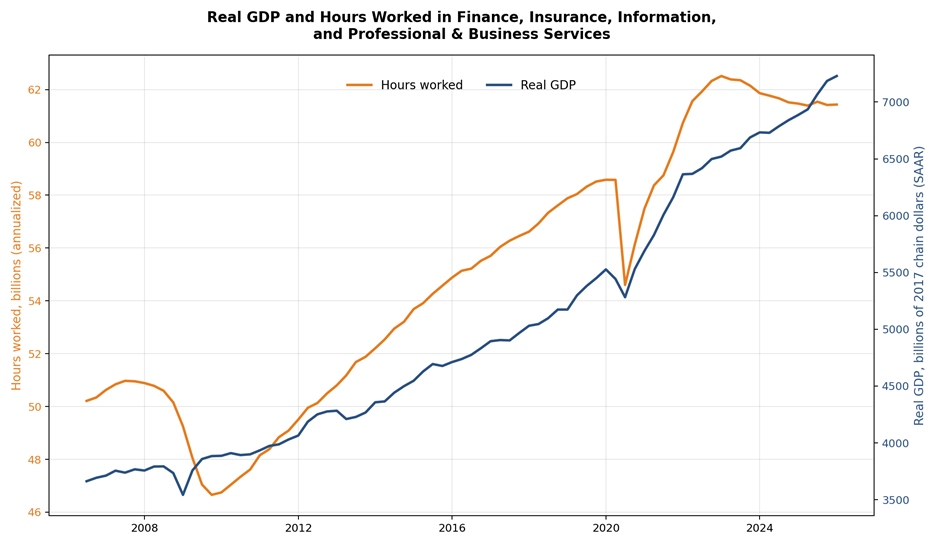
FIIPB — finance and insurance, information, and professional and business services — accounts for more than 40% of private-sector GDP. The grouping spans software and cloud computing, IT consulting and advertising, banking and insurance, and broadcasting. What unites these industries is high knowledge-intensity and, increasingly, exposure to AI and digital automation.
The chart shows the long-run pattern: since 2006, FIIPB’s real output has nearly doubled while hours worked have grown only 22%. The two series tracked closely until about 2022, when hours plateaued and output continued to climb. That inflection is visible as a widening gap between the lines in the final three years of the series. The latest data, through Q4 2025, show the divergence continuing to widen. The forces behind it differ by component.
Information
Source: BEA GDP by Industry, BLS Current Employment Statistics
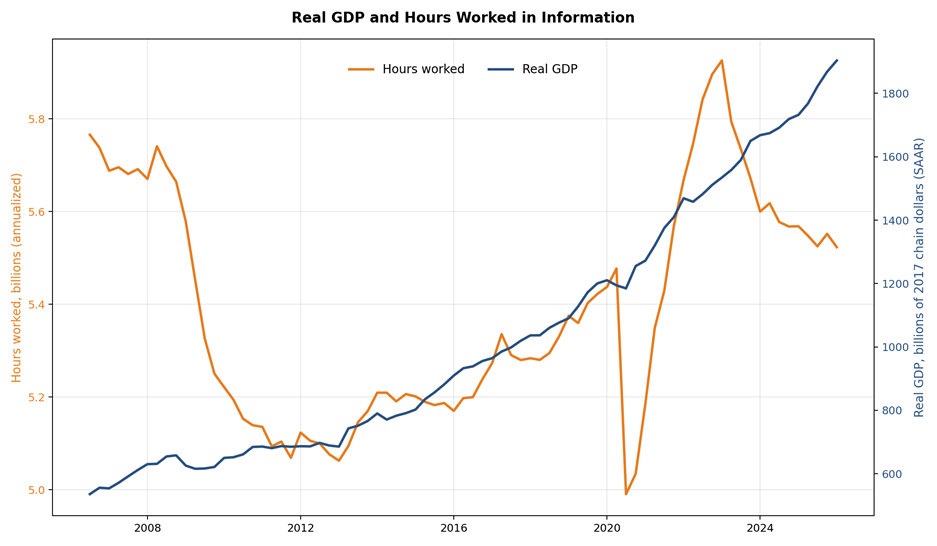
The information sector shows the divergence in its starkest form. Look at the right side of the chart: real GDP (blue) accelerates upward from 2020 while hours (orange) peak in 2022 and decline. The magnitudes are large — real GDP has more than tripled since 2006, while hours are roughly flat for the full period and down 6% from the 2022 peak. Post-2022 annualized: GDP +8.4%, hours −1.9%.
The most plausible interpretation is that several reinforcing forces are at work: AI-assisted software development accelerating output per developer, post-2022 streaming rationalization reducing headcount in media, and machine-learning-driven advertising platforms generating more revenue per employee. The data do not isolate these channels individually, but the pattern is consistent with firms across these sub-industries learning to produce more with fewer hours. The data likely understate what is ahead — the larger productivity effects will come not from faster individual tasks but from firms restructuring teams and roles around these capabilities.
Professional and business services
Source: BEA GDP by Industry, BLS Current Employment Statistics
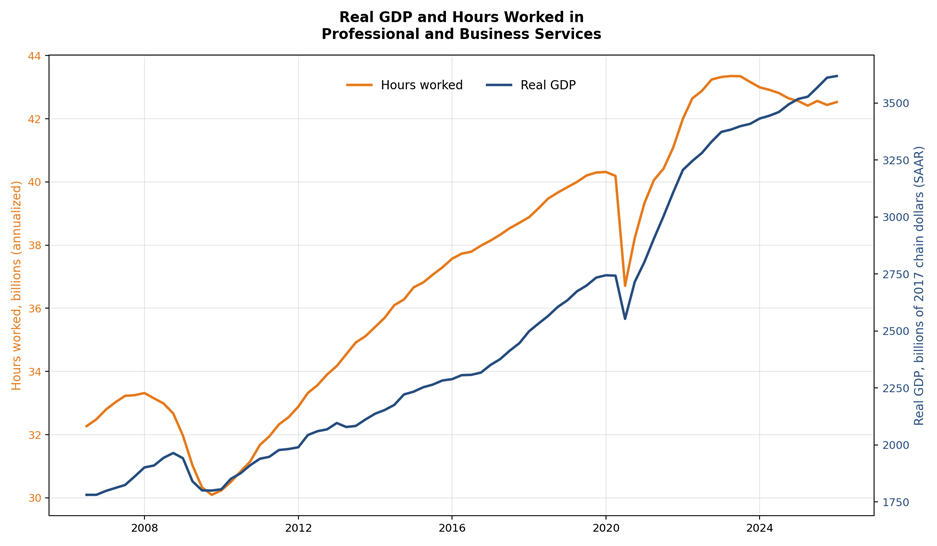
Professional and business services is the largest FIIPB component by employment, so even a modest divergence carries weight in the aggregate. The chart shows a long period of parallel growth in GDP and hours, followed by a visible split after 2022: GDP (blue) continues upward while hours (orange) flatten and edge down. Over the full period, real GDP is up 103% and hours 32%. Post-2022 annualized: GDP +3.0%, hours −0.4%.
This sector — which includes, among others, computer systems design, advertising, management consulting, and legal services — likely reflects two overlapping forces. AI-powered automation appears to be reducing demand for junior professionals in consulting, accounting, and legal work, where tasks like document review and report generation increasingly require fewer people. And the deeper shift may still be ahead: firms are beginning to redesign teams, flatten management layers, and rethink which roles need to exist — organizational changes that take longer than tool adoption but compound over time.
Retail trade: platformization is finally showing up in the data
Source: BEA GDP by Industry, BLS Current Employment Statistics
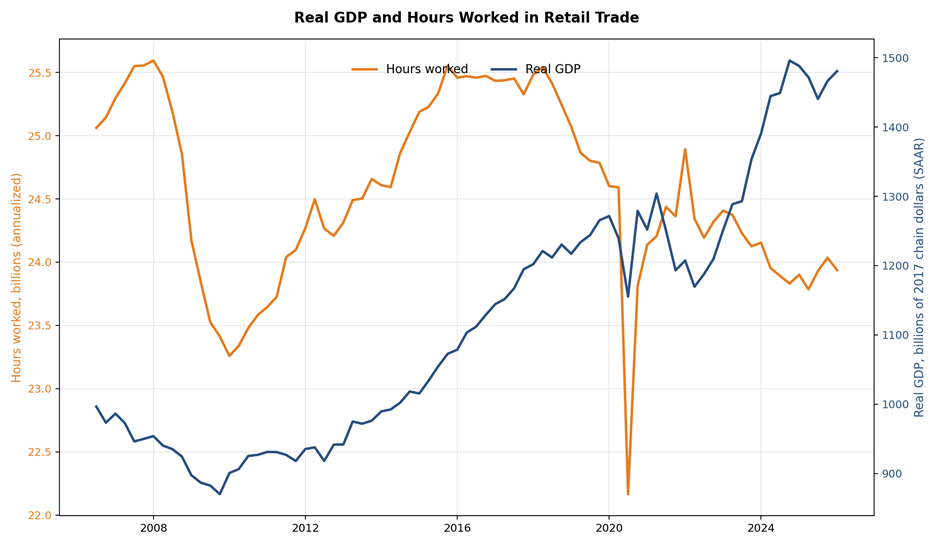
Retail demonstrates that the productivity shift extends well beyond white-collar services. The chart tells a dramatic story: hours worked (orange) peaked in 2007 and have never recovered — they partially rebounded by 2019 but remained below the 2007 peak, and COVID pushed them lower still. Meanwhile real GDP (blue) has climbed steadily and recently accelerated. Over the full period, real GDP is up 49% while hours are down 4.5%. Post-2022 annualized: GDP +6.7%, hours −0.5%.
The most plausible structural driver is platformization. E-commerce ecosystems have replaced distributed store labor with centralized software and logistics infrastructure. In-store automation — self-checkout, AI-driven labor scheduling, automated inventory management — reinforces this. And platformization is expanding rapidly into categories that were until recently labor-intensive and local: Amazon Pharmacy and PillPack in pharmacy fulfillment, Instacart, DoorDash, and Walmart+ in same-day grocery delivery. A gradual shift in the retail mix toward higher-value categories likely contributes as well. The dynamic is self-reinforcing — each category that moves onto a platform generates data and logistics density that makes the next category easier to absorb. These are process and organizational changes, not cyclical ones. (The three-year acceleration is striking enough to invite skepticism — short windows can be sensitive to endpoint effects, and post-2020 inventory and price normalization may affect the measured swing. But the broader long-run pattern, in which retail hours peaked in 2007 and have never recovered while output has grown steadily, supports the platformization interpretation.)
Advanced manufacturing: industrial policy, automation, and product mix
Source: BEA GDP by Industry, BLS Current Employment Statistics
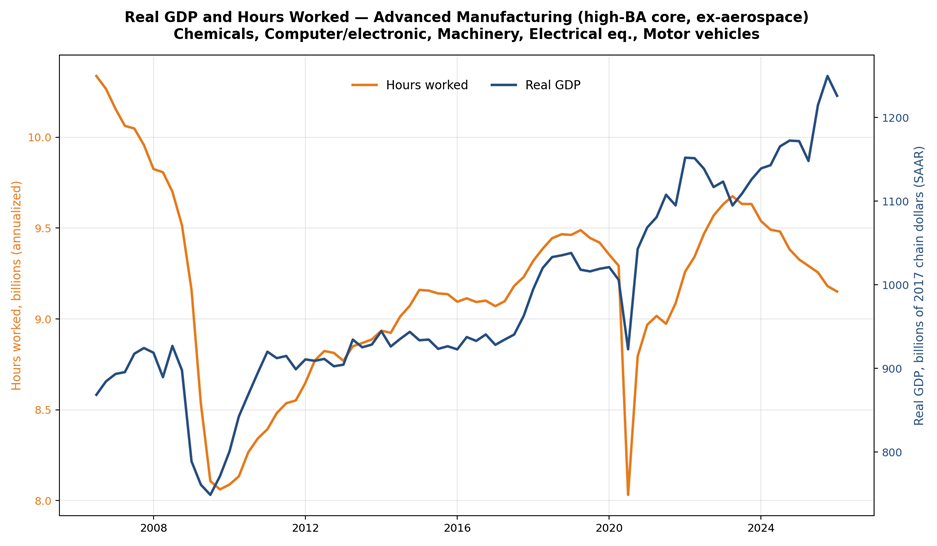
A basket of five high-R&D manufacturing sub-industries — chemicals, computer and electronic products, machinery, electrical equipment, and motor vehicles — shows a longer-running version of the pattern. Hours (orange) have been on a slow structural decline since 2006 and never recovered from the 2020 collapse. Real GDP (blue) was flat to declining through 2016, but began accelerating after 2020 at a pace the sector has not seen in two decades. Over the full period, output is up 41% while hours are down 11.5%. Post-2022 annualized: GDP +2.7%, hours −1.3% — roughly 4% labor productivity growth, well above the 2.1% aggregate nonfarm pace.
Three forces are at work, in likely declining order of contribution. First, product-mix shifts toward higher-value output: pharmaceuticals within chemicals (GLP-1s, biologics) and semiconductors within computer and electronic products, pulled by AI infrastructure demand running through existing U.S. capacity. Second, rising industrial robot density and process automation inside existing plants, accelerated as firms met post-pandemic labor shortage with capital rather than headcount. Third, early capital deepening from CHIPS and IRA — real but still small, since most new capacity was not yet operating during the chart window.
What kind of structural shift?
U.S. labor productivity growth has accelerated, rising from 1.3% per year in the pre-pandemic expansion (2013–2019) to 2.2% in the post-pandemic period (2019–2025). There are no signs of a slowdown in 2025, and early 2026 job growth points to continued flat employment outside healthcare and social services. The post-2019 acceleration appears overwhelmingly structural rather than cyclical.
But not all structural gains are alike. The right question is whether the improvement mostly reflects one-time level shifts that have largely run their course, or whether compounding forces will continue to push productivity higher. The evidence points to both — but the balance is tilting toward the latter.
Part of the acceleration does reflect one-time shifts triggered by the pandemic. The culling of marginal low-productivity businesses mechanically raised the surviving average. Remote and digital adoption compressed a decade of diffusion into two years — cloud collaboration, digital payments, virtual service delivery. E-commerce permanently rerouted a larger share of retail through higher-productivity fulfillment models. These were important gains. But they are largely exhausted: the businesses that were going to fail have failed, the digital tools that were going to be adopted have been adopted, and the e-commerce share has stabilized. They raised the productivity level. They do not keep raising it.
The forces that do keep compounding are earlier in their development, which is why the forward outlook matters more than the backward accounting. Generative AI is still in early deployment; the frontier of automatable tasks — coding, analysis, legal review, financial modeling, customer support — keeps advancing. But the larger effect will likely come from organizational redesign rather than task acceleration: firms restructuring teams, flattening management layers, and eliminating roles, a process that is inherently slower than software adoption and therefore mostly still ahead.
Platform consolidation continues concentrating output in higher-productivity business models, with each increment of market share making the next easier to capture. Cloud and AI infrastructure buildout — not just data centers but the electricity generation, transmission, and cooling systems behind them — represents long-cycle, capital-intensive domestic investment with high labor productivity. Software and R&D investment rose sharply in 2025, driven by AI-related spending, and increasingly looks like a durable shift in the composition of business investment toward intangible, high-productivity capital. And CHIPS Act and IRA facilities are still mostly under construction; their main productivity contributions are ahead, not behind.
There is also an emerging wild card: AI-based robotics. Foundation-model humanoids and generalist manipulators are attracting serious capital, though actual deployment in U.S. manufacturing remains negligible. If deployment scales, robotics could become a meaningful contributor in the late 2020s — a plausible upside scenario, not a baseline assumption.
The conclusion is not that the productivity acceleration was purely a post-pandemic reset. It was partly that. But it also marks the early phase of a broader structural transition, in which the economy is shifting toward technologies, sectors, and business models that generate more output with fewer hours worked. Many of the most important forces — AI deployment, organizational redesign, platform expansion, infrastructure buildout — still have considerable room to run. That is why the acceleration increasingly looks less like a temporary distortion and more like a new structural regime.
Methodology: Aggregate productivity data from BLS Nonfarm Business Sector (series PRS85006043, PRS85006013, PRS85006093). Industry-level real value added from BEA GDP-by-Industry Table 10 (April 9, 2026 release). Hours worked from BLS Current Employment Statistics all-employee average weekly hours and employment. Decomposition uses a standard shift-share framework with Törnqvist-averaged nominal value-added weights. FIIPB = finance and insurance (NAICS 52), information (51, including software publishing, cloud/data centers, broadcasting, and telecom), professional and business services (54–56, including computer systems design, advertising, and management consulting). Advanced manufacturing = chemicals (325), computer and electronic products (334), machinery (333), electrical equipment (335), motor vehicles and parts (3361–3363).