
Who’s Still Quitting? The Uneven End of the Great Resignation
By Gad Levanon and Mels de Zeeuw
The quits rate is a key barometer to understand the labor market. It’s a key proxy for labor-market tightness and hiring difficulty, closely watched by employers. Because quits capture how often workers voluntarily leave, they signal how costly it will be for firms to recruit, train, and bring new employees up the learning curve—costs that translate into lost productivity and higher replacement expenses. When quits remain subdued, companies feel less pressure to keep workers happy through higher pay, flexible schedules, or generous benefits, since the risk of losing talent is lower.
Every month the Job Openings and Labor Turnover (JOLTS) survey from the Bureau of Labor Statistics provides data on quits, separations, and layoffs, which allows us a timely look on whether employers are facing a tight labor market, or whether their workers’ employment positions are worsening.
However, while JOLTS is great for national, industry and state trends, it can’t tell us who is doing the switching and doesn’t offer data by occupation, education, age, or race/ethnicity. Building on Bart Hobijn’s approach, we link CPS microdata to JOLTS to estimate quits, layoffs, and total separations for detailed worker groups. That matters because knowing which groups are quitting shows exactly where the pressure is, and where it isn’t.
Methodology
To estimate quits rates by non-JOLTS demographics such as age, occupation, or educational attainment, we use microdata from the Current Population Survey’s monthly survey. We first determine whether workers in each month transitioned from one employer to the next, or from their job into unemployment or out of the labor force; and whether they did so voluntarily or involuntarily. For some respondents we could identify a separation, but not the reason behind it. Quits, layoffs, and indeterminable sum to total separations.
Next, we created monthly averages for these three measures by industry, and anchored these to the equivalent seasonally adjusted JOLTS industry-level metrics to create adjustment factors. For each month and 2-digit NAICS industry combination we apply the factors to the CPS weights so adjusted measures of quits, layoffs, and separations match JOLTS at the industry level. This then allows us to analyze these rates by a variety of other demographic data present in the CPS.
To adjust for low observations counts and seasonal biases, we present results as 12-month moving averages, and omit demographic sub groups with too few observations to draw meaningful conclusions. This does mean turning points may appear with a lag. Finally, we’ve calculated both the rates, as well as the change in these rates from their peak in March 2022 during the Great Resignation, and expressed each month’s value as a percentile of that groups rates over the entire almost 24 year timeframe. We present some of this analysis below.
From the ‘Great Resignation’ back down to reality
As Figure 1 shows, resignations among workers rose steadily during the 2010 through 2019 period, dropped sharply during the COVID recession, before rising sharply and peaking in March 2022 in the period dubbed the ‘Great Resignation’. Since then, the quits rate has dropped steadily before stabilizing somewhat in 2025.
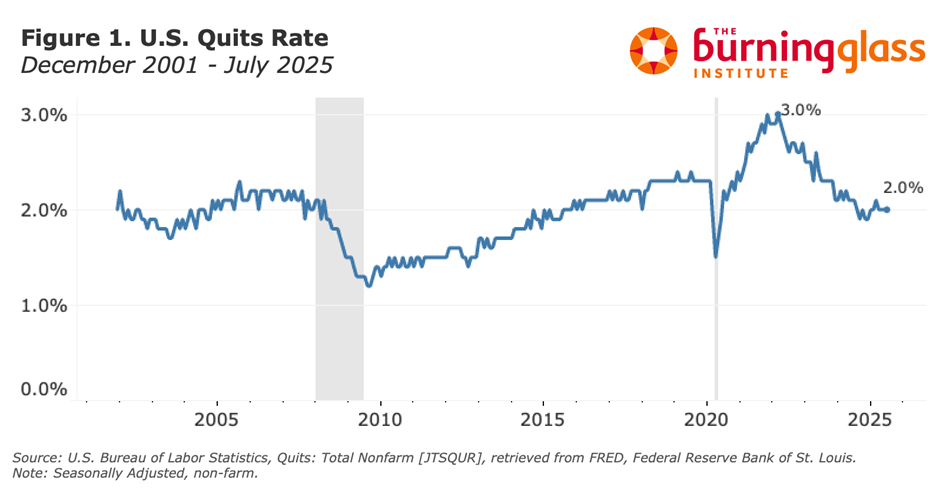
While the quits rate is still well above the lows of the Great Recession, in July 2025 it was below the historical norm, at its 42nd percentile. It remains to be seen whether resignation levels will stabilize or decline further, but clearly workers’ bargaining power has worsened in the past three years. However, as we will show, these declines have not occurred evenly across the board. We find a striking divergence in quits rate trends between young and older workers, between those with lower- and higher educational attainment, and between white- and blue-collar workers.
No country for young bargainers
As figure 2 shows, younger workers exhibit increasingly lower rates of resignation. While quits rates have declined among workers in all age groups, drops have been largest among those below the age of 40. Workers between 16 and 24 years old in particular are experiencing historically tight conditions, with their July 2025 quits rate being among the bottom quartile of the prior two and a half decades, and the lowest since December 2014.

Divergence by educational attainment
Figure 3 depicts trends in quits rates by educational attainment. Workers with less educational attainment have historically elevated quits rates compared to the prior two and a half decades (60-69th percentile). The notable exception occurs among workers with occupational/vocational associate’s degrees, which have a historically smaller churn (45th percentile).
The segment of workers with college degrees have resignation rates that are historically quite low. This is particularly striking among workers with PhDs (3rd percentile), where their quits rate in July 2025 marks one of the lowest months in the past 25 years. The last time the PhD quits rate was this low was April 2014.
It appears retention for Master’s and PhD graduates is currently relatively easy, while though easing it remains comparatively difficult to retain blue-collar workers. Given declining numbers of non-college educated workers, and a growing number individuals who are college educated, we can expect this divergence to persist.

A two-track labor market: diverging occupation trends
As figure 4 illustrates, this historical trend in quits rates shows sharply diverging trends by occupation. Various blue-collar skilled, hands-on, and licensed roles remain historically hot. Quits rates among workers in Protective Services (87th percentile); Installation, Maintenance, and Repair (87th); among Health-care support and Community and Social Service roles (like social workers and counsellors) rates are at their 80th percentile; and among Health-care practitioners they are at their 77th percentile. On the other hand, quits rates are at near-historic lows among white-collar workers in Computer and Mathematical occupations (20th percentile); and in Life, Physical and Social Science jobs (11th percentile).
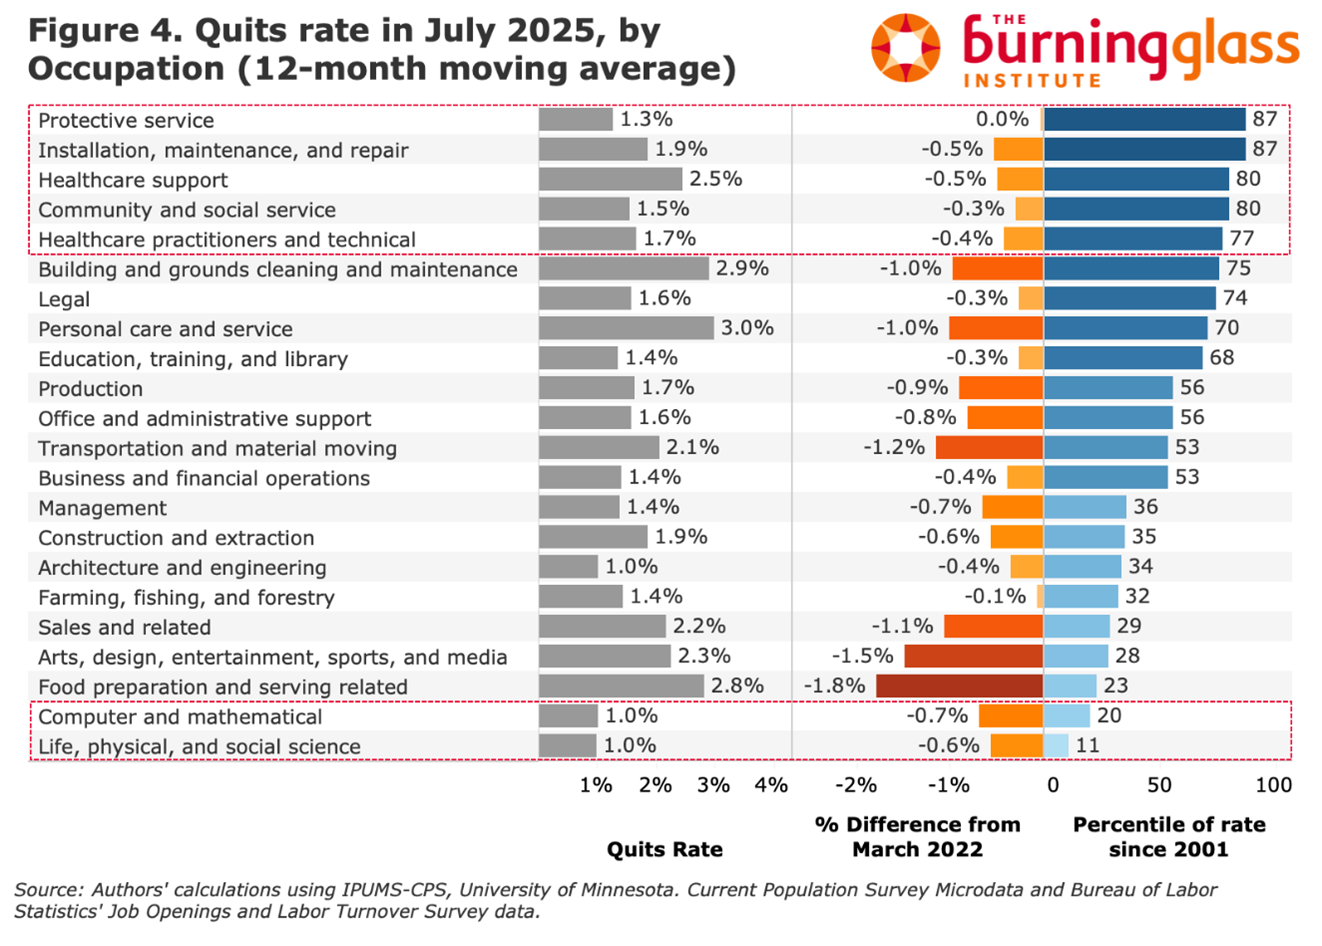
The results show some signs of a two-track labor market, wherein white-collar workers in Computer and Life/Physical/Social Science occupations have some of their lowest resignation rates in the past two decades; whereas conditions are tighter for employers in blue-collar installation and healthcare occupations.
Conclusion
While the Great Resignation is clearly over in aggregate, that conclusion masks important variation across the labor market. In July 2025, the national quits rate stood at around 2.0%, placing it at the 42nd percentile of the past 25 years—a clear sign that overall worker bargaining power has weakened from pandemic-era highs. However, newly developed demographic-specific quits measures—linking CPS microdata to JOLTS benchmarks—reveal a much more uneven picture beneath the surface.
To better capture these divergences, we analyzed not just raw quits rates but historical percentiles, comparing today’s values to each group’s own experience since 2001. This approach highlights whether quits are unusually high or low relative to each group’s history, offering a more accurate view of labor market strength.
Several patterns emerge. Younger workers are quitting at relatively low rates, reflecting historically weak bargaining positions compared to older age groups. Workers with advanced degrees are easier to retain than at almost any point in the past quarter century, while employers continue to face elevated churn among less-educated workers. White-collar jobs show lower turnover, whereas manual and blue-collar occupations still experience heightened churn. These patterns reflect a deeper mismatch in labor supply and demand, particularly across education levels and age groups.
On one side of the labor market, the supply of non-college workers is shrinking. Boomer retirements have been concentrated in blue-collar and manual service occupations, and tighter immigration—especially reduced undocumented inflows—has made replacement harder. College graduates rarely transition into these roles, so the labor pool for occupations in construction, food service, health support, maintenance, and logistics continues to thin. At the same time, demand for manual labor has remained steady—or even strengthened—in many sectors, helping to keep quits historically elevated in these occupations despite broader cooling.
On the other side, the number of college graduates continues to rise. This expanding supply is colliding with technological shifts, as generative AI automates routine analytical tasks and employers become more selective in hiring. Entry-level white-collar jobs have become the margin of adjustment, while employers increasingly favor experienced hires. The result is historically low quits among college graduates, especially those with advanced degrees. However, one puzzling finding remains: workers with graduate degrees are quitting at even lower rates than those with only a bachelor’s degree, a divergence that current explanations—supply growth, automation, or hiring shifts—do not fully account for.