
Shifting Demographic and Education Trends and Their Impact on the U.S. Workforce
By Gad Levanon and Frank Steemers
America’s labor market is undergoing a structural shift, and our report projects how this will unfold across gender and education. With Boomer retirements accelerating and immigration only partially offsetting the decline, the working age population is no longer growing. Yet nearly every net addition in the coming years will have a bachelor’s degree.
By 2034, we project that the non-college population will be significantly smaller, while the number of degree holders continues to grow steadily. This raises the risk of a graduate surplus, especially as generative AI dampens white-collar job growth.
The gender dimension makes the imbalance even sharper. Our projections show that college-educated women will continue to surge, while non-college women, the core workforce for care, service, and support roles, decline rapidly. These are jobs that can’t be automated, offshored, or done remotely. As a result, hospitals, factories, and construction sites will face intensifying competition for the shrinking pool of hands-on workers.
The Slow Squeeze on America’s Workforce
It’s well known that the U.S. working-age population (ages 18–64) is barely growing—and that this stagnation will likely persist for at least the next decade. From 2017 onward, annual growth has slipped below 0.2%, a dramatic break from the 1–2% pace that characterized much of the 20th century. The chart shows why.
In the early 2000s, far more 17-year-olds were aging into prime-working age than 64-year-olds were aging out, adding nearly a full percentage point to labor-supply growth. In recent years, As the last Baby Boomers retire and the smaller Gen-Z cohorts replace them, that orange aging line essentially reaches zero.
The red migration line reflects an annual contribution of about 0.15 to 0.20 percentage points in the Census Bureau’s low-immigration scenario. Why focus on the “low” scenario?
This projection comes from the Census Bureau’s 2023 National Population Projections, which offer several immigration pathways. We chose the low-immigration variant to illustrate what could happen if U.S. policy shifts toward a more restrictive approach, similar to the Trump-era policies that sharply reduced refugee admissions and tightened border enforcement. Such a shift is plausible following the surge in undocumented immigration between 2022 and 2024.
The grey line tracing overall prime-age growth slides from more than 1% in 2000 to near-zero through 2035. Under present, low-immigration assumptions, the United States is entering a decade, or more, of flat or shrinking prime-age labor supply.
Chart 1

However, a much less reported, but perhaps more consequential, trend is underway beneath the surface.
The decline in the working-age population (ages 20–64) applies only to those without a college degree. In contrast, the number of working-age people with a bachelor’s degree has been rising consistently and steadily—and is projected to continue growing at 1–1.5% annually through at least 2035 (Charts 2 and 3).
Chart 2
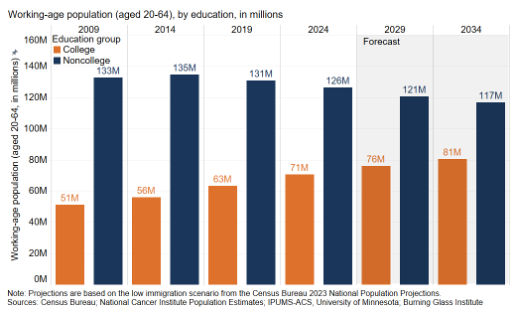
Chart 3
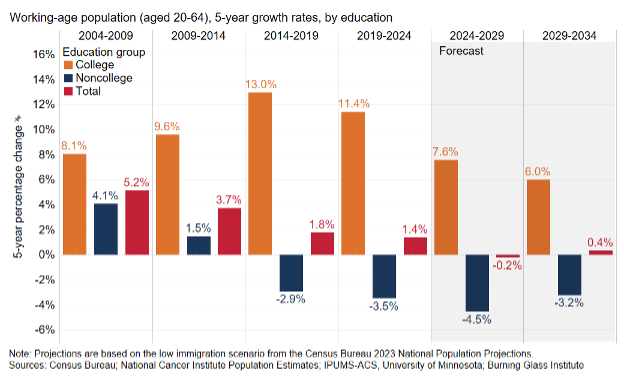
Why? Because the rising generation of young adults is far more likely to hold a bachelor’s degree than the retiring cohorts they’re replacing. That compositional shift is reshaping labor supply, not just in size but in kind.
And it matters. People with a bachelor’s degree typically avoid blue-collar and manual services occupations, roles in transportation, production, construction, farming, maintenance and repair, food services, cleaning, security, personal care, and health support. As a result, the supply of available workers in those roles is shrinking, and will continue shrinking in the decade ahead.
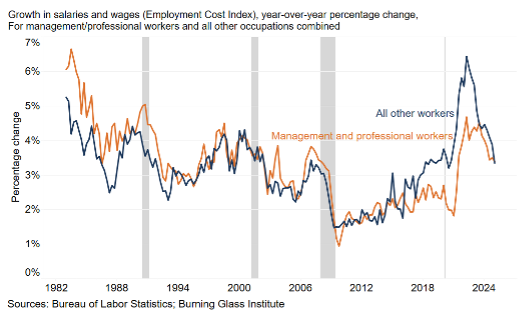
That’s a problem, because demand for blue-collar and manual service workers remains strong and in many cases is rising (Chart 4). Despite the steady expansion of the knowledge economy and white-collar employment, manual jobs have proven far more resilient than many expected.
Chart 4

As a result, in recent years labor shortages were more severe, and wage growth was higher, in blue-collar and manual services jobs than in white-collar ones, a complete reversal from the dominant pattern of recent decades, where employers struggled most to hire workers with college degrees.
Chart 5
Yet that backdrop of demographic scarcity collides with another force moving at rapid speed: generative AI and other productivity improving factors are starting to erode the very white-collar headcount that once seemed scarce.
For the labor market this means that a continuation of the existing trend: the pinch point will be blue collar and manual services jobs. Jobs our aging population still needs but AI can’t yet nail, while many college-pathway office jobs will see slower hiring and flatter wages. Over time that shift could further compress the college wage premium.
A Gender Divide: Steeper Declines Among Non-College Women
The shrinking non-college workforce is being driven disproportionately by women. Over the past decade, the number of working-age women without a bachelor’s degree has declined far more steeply than men. Projections suggest this gap will widen, creating growing imbalances in frontline service jobs that rely heavily on non-college female labor.
At the same time, women continue to outpace men in higher education. College-educated women now significantly outnumber college-educated men—and that lead is expected to grow.
This shift has major implications. As non-college women exit the labor pool, care-focused sectors like healthcare support, childcare, and personal care face acute staffing pressure. These hands-on roles can’t easily be automated and will need to adapt—by boosting wages, improving job quality, or expanding recruiting pipelines—to keep up with demand.
Chart 6

Conclusion
Demography and education are steering the labor market toward an odd equilibrium: too many degree holders, too few hands-on workers. Employers in transport, trades, and care will confront chronic vacancies and rising wages, spurring automation and pressuring policymakers to expand vocational pathways, immigration, and participation incentives. Conversely, an oversupply of graduates, particularly women, could flatten starting salaries The gender wrinkle matters: frontline sectors most starved for labor draw heavily from the very group of non-college women disappearing fastest.
Methodology for the Population Projections by Education
This analysis creates education-specific population projections using a methodology consisting of three main components:
Population Data Integration and Calibration
The analysis begins by integrating historical population estimates from the U.S. Census Bureau (through 2024) with the official 2023 national population projections. These datasets are harmonized using a growth rate calibration function that ensures smooth transitions between the historical and projected periods while maintaining consistency with the most recent available data. The analysis relies on the “low” immigration projection scenario.
Education Data Distribution
Educational attainment patterns are derived from the American Community Survey, which provides information on educational attainment by age, sex, and year. The analysis classifies education into two categories: below BA and BA and above. Education shares are calculated for each 5-year age group and gender up to 2024.
Projection Approach
The analysis employs two complementary projection methods, each suited to different age groups and time horizons:
Cohort Change Ratio (CCR) Method: Applied to older age groups (30+ years), this method tracks how each 5-year age/gender/education group evolves as cohorts age over 5-year periods. The CCR is calculated as the ratio of the population in each group in 2024 (e.g., women with a BA aged 45–49) to the same cohort’s size in 2019 (e.g., women with a BA aged 40–44). The observed pattern (CCR 2019–2024) is applied to estimate the education-specific population in 2029 and 2034.
Constant Method: Used for younger age groups (under 30), this approach assumes that education shares remain constant after 2024. This reflects the reality that many younger individuals have not yet completed their education. The CCR method for these younger age groups was found to be too volatile.
The resulting education-specific population estimates are then calibrated to match the total population projections from the Census Bureau, ensuring consistency with official demographic projections.