
Introducing: BGInsights
Featuring monthly research and insights from the Burning Glass Institute team.

Worst Practices
The Best Practices Survey is a familiar fixture of our sector. With so many nooks and crannies across our thousands of state and local governments and millions of nonprofits that, yes, there are plenty of good ideas hidden in place.
But most of the time, the problem isn't a lack of good ideas but a lack of good practice. It's about breaking away from the things holding us back. Instead of doing one more thing right, we should stop doing so many things wrong.
So, a few months ago—after years of musing on it half-jokingly—the two of us decided to launch the inaugural edition of the Worst Practices Survey. We think it's time to look those Worst Practices squarely in the eye and decide never to repeat them.
We conducted wide-ranging outreach (…put a survey on LinkedIn) and established a representative sample (…a few dozen people we know) from across different parts of the social sector (to be fair, we actually did get some good diversity here—a nice balance of practitioners, foundations, and government leaders). Here’s what we heard.
By Stuart Andreason and Jake Segal (Social Finance)
The Best Practices Survey is a familiar fixture of our sector. With so many nooks and crannies across our thousands of state and local governments and millions of nonprofits that, yes, there are plenty of good ideas hidden in place.
But most of the time, the problem isn't a lack of good ideas but a lack of good practice. It's about breaking away from the things holding us back. Instead of doing one more thing right, we should stop doing so many things wrong.
So, a few months ago—after years of musing on it half-jokingly—the two of us decided to launch the inaugural edition of the Worst Practices Survey. We think it's time to look those Worst Practices squarely in the eye and decide never to repeat them.
We conducted wide-ranging outreach (…put a survey on LinkedIn) and established a representative sample (…a few dozen people we know) from across different parts of the social sector (to be fair, we actually did get some good diversity here—a nice balance of practitioners, foundations, and government leaders). Here’s what we heard.
CHASING WATERFALLS
In keeping with the season, by far the most common gripe we hear is about breaking bad habits. This isn't just about ending virtue signaling. It's about escaping from faulty mental models.
Avoid "magic bullet" thinking. Funders—especially philanthropic and government grantmakers—are "addicted to the belief that they just need to fund innovative new ideas that will magically solve things." They want unicorns, so they're underwhelmed by even the handsomest horses.
Self-indulgence is a dangerous drug. Accountability is often self-imposed, which can lead to "vanity metrics" and pseudo-academic evaluations designed to support a thesis. (This feedback hit close to home, with one respondent noting that "third-party ROI studies”—which both BGI and Social Finance, at times, do—"are a joke. There are no standards and they're useless. I always ignore them and you should too.")
Demonstrations that don't have a ready audience. We don't operate in highly functioning markets (and often we aren't operating in markets at all). So the idea that a great model, once demonstrated, will be taken up around the nation is…dubious.
GRADING YOUR OWN HOMEWORK
When it came to poor evaluation practices, respondents did not hold back. (I'm sure this is, in part, because we're a couple of nerds and our network oversamples other nerds.) (But I'll tell you, these really speak to us.)
Do measure more. (Or at all.) One commenter put it plainly: far too often, we simply "refuse to evaluate or reassess program effectiveness" at all. That makes it impossible to know what's working and what to improve.
But don’t measure self-servingly. There was a lot of consternation about "programs padding the numbers" and "cherry-picking data to match hypotheses." Poor evaluation practices that make a favored program look good undermine the purpose of evaluation. Similarly, the bottom-drawer effect—"not releasing a study when the data is bad or not favorable"—weakens the field. This is a common complaint in the academic world as well: journals and research are biased towards positive results. Studies that find no effect rarely get published.
Garbage in, garbage out. This one's for my true nerd friends: "bad meta-analyses…overstate the strength of evidence by including studies with high risk of bias or focusing only on short-term or intermediate outcomes." Yes; yes, they do—and it drives us crazy. These are the synthetic CDOs[1] of the impact world: evidence that seems solid but whose underlying quality is hard to assess.
COMPLEXITY BIAS / THE FIELD OF DREAMS FALLACY
This category is a plea for practical focus—one that might best be summarized by, simply, “Come on, people.”
Stop talking, start doing. Thoughtfulness is good! But respondents agreed that philanthropy, especially in the face of fast-moving change, should move faster. Beware "program officers working on the fifth version of their strategy in as many years." (This tendency toward talk wasn't merely anecdotal: respondents from the philanthropy sector used 35% more words in their survey responses than anyone else.) No one commented on whether government should move faster or slower; perhaps that particular question is, at this moment in time, probably worthy of a separate survey (and a few martinis).
Build capacity to meet the moment. Many organizations—both public and private—try to control costs with headcount freezes. But especially within government this can lead to workarounds that are more expensive still, when they "direct work to high priced and temporary consultants or contractors." We should build capacity and drive efficiency; short-term solutions are only that.
Look who's talking. One respondent highlighted a strangely common hypocrisy,"a conference room full of people with master's degrees talking about why college is not necessary." Making good decisions requires building on expertise, especially first-hand expertise.
Get real on timelines. Quite a few respondents weighed in on lopsided timelines. Too many foundations have "very long application processes with quick turnaround times for the applicants." Meanwhile, governments "take months to pay invoices for nonprofit service providers." Not surprisingly, nonprofits were especially frustrated here, with 40% calling it out as a major pain point.
RELYING ON POWERPOINT TRUTHS
Simple, clear communications are good. Saying that a car can go from zero to 60 in four seconds makes it clear it's fast. But that doesn't mean the work itself—the engineering required to design the car—is simple. We need experts making sophisticated decisions so we can talk about them simply.
Reach isn't the ballgame. It's year-end report time, and just about every organization and government agency we see describes programs in terms of the number of people reached. That can be meaningful, but often it's simplistic to a fault. Consider reporting on the outcomes of the people reached—did their lives get better?
Know your stuff. Then there’s the issue—exacerbated by AI, no doubt—of decision makers being too far removed from specifics of what they’re overseeing. "There’s a lot of modernization efforts that don’t understand the systems they try to change or the technology," wrote one respondent. Successful modernization requires a deep understanding of the original processes and intended goals.
WHAT WAS NOT MENTIONED…AND WHAT WAS
We were a bit surprised that there wasn’t much mention of any specific programs or policy verticals that people were jaded about, saw as a boondoggle or worst practice. Especially with the early 2025 chaos that hit programs in the Department of Education, Job Corps, and many other workforce and education programs, we expected to hear more about the things that people may be willing to see eliminated. We also anticipated that the upending of programs a year ago may have led to a greater rethinking of what worked and what didn’t, but these…did not show up in our responses.
Respondents focused on process, measurement, and execution—these seem to be pervasive across different places in the ecosystem. From ROI studies to measures of reach, philanthropies were cautious about the measurements that were shared with them—and potentially funded by them. Nonprofits felt that measurements and timelines from funders created undue burden and limited value.
Where does that drive things? Towards effective, vulnerable, and realistic leaders. The entire ecosystem seems to be calling for each player to do less corner cuttingand to focus on quality execution, process, and measurement. Most of this isn’t rocket science; it isn’t about honing new skills, so much as shrugging off legacy baggage. It’s a new year, and it’s time to make the best of it.
[1] For those of you who tuned out in 2008: collateralized debt obligations are financial instruments whose complexity and opacity makes their riskiness challenging to assess; they’re widely blamed for accelerating the financial crisis. The point of the analogy here is that meta analyses often seem good, but are built on a wide range of studies with varying levels of relevancy, and can be hard to understand or tie to the specific use case – so it’s hard to know how risky it is to use them without interrogating the underlying studies.

The Long Game: How College Rankings Change Over the Career Lifecycle
This report examines how the long-term economic value of a college education evolves, focusing on the earnings trajectories of liberal arts college (LAC) graduates. While LAC alumni often earn less early in their careers—partly due to entering lower-paying, socially valuable fields—they tend to catch up over time, narrowing or closing the earnings gap with peers from other institutions. Using Burning Glass Institute’s comprehensive labor market data, the study explores how career mobility, graduate education, and generalist skills shape this catch-up, offering a more nuanced view of college rankings and long-term value.
By Gad Levanon, Joseph Winkelmann and Mels de Zeeuw
Introduction
Understanding the long-term economic value of a college education is a central concern for students, families, and policymakers. One popular approach to measuring this is through alumni earnings. These rankings typically rely on earnings measured just a few years after graduation.
The focus on early years can be especially damaging for liberal arts colleges (LACs). LAC graduates generally earn less than their peers, in part because they are more likely to enter lower-paying but socially valuable fields such as education, the arts, and nonprofit work. Especially after adjusting for student selectivity—using metrics like average SAT scores—graduates from LACs appear to dramatically underperform in early-career earnings. This depresses their position in school rankings and may reduce their appeal to prospective students.
However, much of this underperformance is concentrated in the early years after graduation. Over time, LAC graduates tend to catch up—narrowing or even closing the earnings gap with peers from other institutions. This report investigates how the earnings of different college types evolves from early to mid-career, with a particular focus on liberal arts colleges.
Using the Burning Glass Institute’s comprehensive labor market database, which contains career histories of over 65 million Americans and spanning multiple decades of graduates, we examine both the extent of this earnings catch-up and the factors that may drive it—including occupational mobility, graduate school enrollment, family background, and the long-term benefits of generalist skills.
By tracing these lifecycle dynamics, we aim to inform more nuanced college rankings and contribute to a deeper understanding of what makes a college education truly “valuable” over the course of a career.
Definition, sample and data
Our college sample includes all liberal arts colleges, public research universities, and private research universities in the US. We exclude other types of higher education institutions such as community colleges, for-profits, or professions-focused schools, as these institutions tend to attract different types of students. The institutions in our sample account for around 75% of bachelor’s degrees awarded in the US every year.
Among public and private research universities, we further distinguish high-STEM schools as schools with high shares of certain majors in their distribution of awarded degrees between 2010-2023.[1] We divide 562 schools into the following groups:
1. Liberal arts colleges (N=158)
2. High-STEM research universities (N=80)
3. Other public research universities (N=169)
4. Other private research universities (N=155)
Figure 1 shows how liberal arts colleges and STEM schools differ meaningfully in the programs they focus on and thereby also in the careers they prepare their students for. The figure shows the shares of awarded bachelor’s degrees by school type for distinct degree types. Liberal arts schools stand out as awarding noticeably low shares of business and other professional degrees. Instead, liberal arts schools award a comparatively high share of social science and humanities degrees.

__________________________________________________________________________________________________
Services (11), Engineering (14), Engineering Technologies/Technicians (15), Military Technologies (29), Science Technologies/Technicians (41)
These differences in specializations may contribute to differences in average earnings trajectories between colleges. In our main results below, we measure earnings differences between graduates of different colleges conditional on college major, in addition to demographic controls. Conceptually, we are interested in whether students who major in the same field will expect different earnings trajectories depending on the type of college they attend. We consider some potential reasons for such differences in our analysis and discussion below.
Our earnings measures are based on students who graduated with a bachelor’s degree between 1988 and 2023. We observe earnings outcomes between calendar years 2008 and 2024. Our main object of interest is the average value-add of these four groups of schools at different experience levels, which we define as years since graduation.
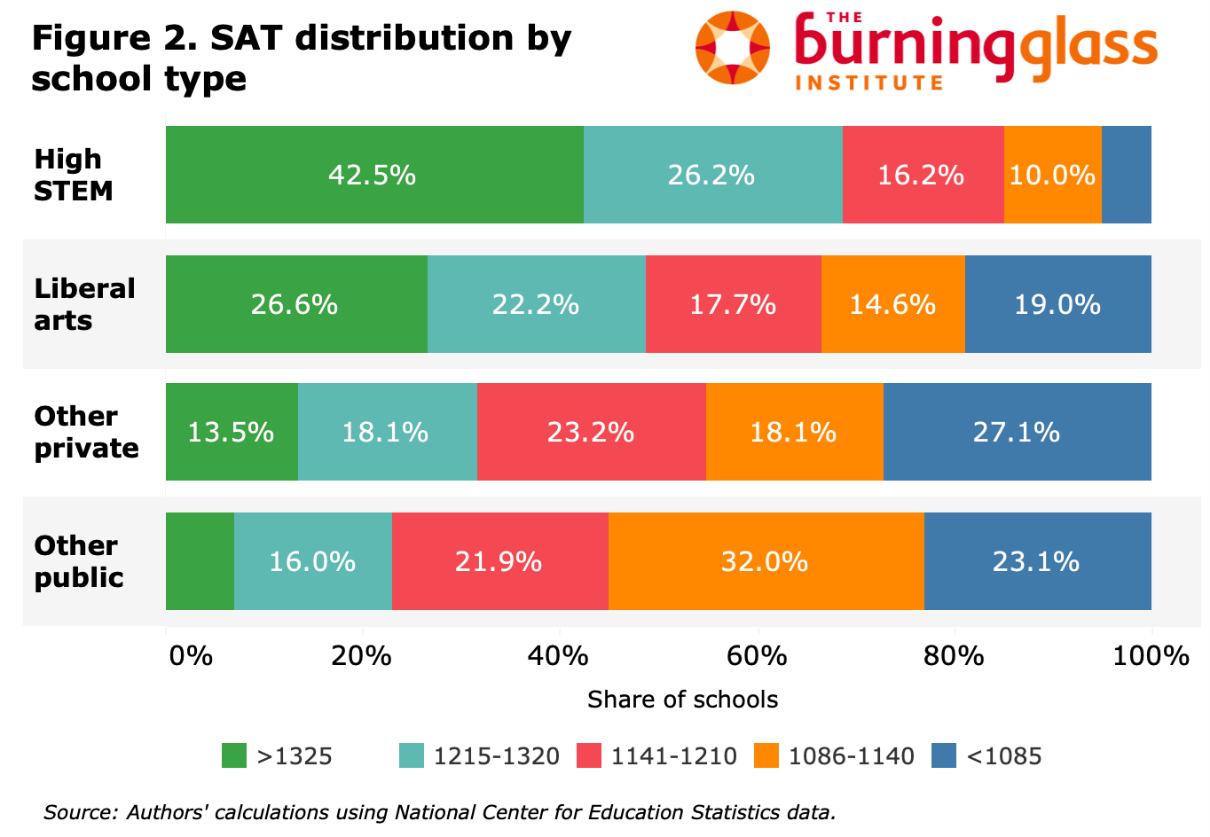
It is important to account for differences in average SAT scores.
Before we get to the main results we need to account for differences in average SAT scores across colleges. Individual earnings depend on many factors, and there is differential selection of students across schools that limits the “value-add” interpretation when comparing raw graduate earnings. It is beyond the scope of our analysis to control for all such factors, but we do control for the average SAT score of admitted students. As Figure 2 shows, SAT scores vary significantly across school types—high-STEM schools are especially likely to admit high-scoring students. Therefore, we present results of our analysis also controlling for SAT to rule out that those differences are driving our findings.
Do Rankings Shift Over Time? Earnings Value-Add by Years Since Graduation
In order to understand differences in lifecycle earnings patterns across school types, we estimate value-add regressions separately by year since bachelor graduation. We regress log earnings on race, gender, degree major, cohort, and school fixed effects. We then average the school fixed effects within types of schools, both raw and controlling for the average SAT scores of admitted students. We exclude currently enrolled graduate students who may have artificially low earnings from part-time or similar jobs. Figure 3 shows the results from that analysis.

Liberal Arts Colleges Results
While this report focuses on changes over time, first-time Labor Matters readers may be surprised by how low the salary value-added is for graduates of liberal arts colleges (LACs). After controlling for SAT scores, LACs consistently rank lowest among the four groups across the entire career lifecycle.
One major reason is that LAC graduates are far more likely to pursue social-impact occupations—roles in fields like education, social services and non-for-profits that contribute to the public good but tend to pay less than other jobs requiring similar levels of education. These positions are vital to society yet remain undervalued in the labor market.
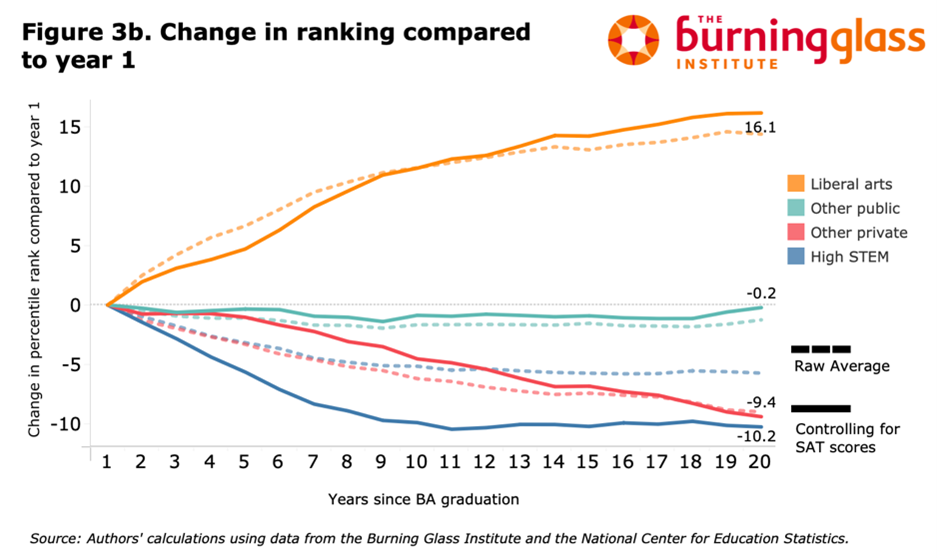
Turning to the over-time analysis, the blue line in Figure 3A shows that liberal arts graduates gradually catch up to the average graduate over time. This pattern is even clearer in Figure 3B, which tracks changes in the average percentile rank by school type relative to the first year after graduation.
As Figure 3 illustrates, graduates of liberal arts colleges gain roughly 15 percentile ranks between the first year after graduation and 15–20 years later. In the left-hand chart (without controlling for SAT), LACs start with the lowest value-add among the four groups but, by year 15, trail only the high-STEM group.
By contrast, graduates of high-STEM schools and private research universities look especially strong in the early years after graduation but lose some ground over time—even though they continue to earn the highest salaries on average. In general, the type of college one goes to matters much more at the beginning of one’s career than in the middle of it.
While Figure 3 compares general patterns between the different types of schools, Figure 4 shows the school-specific trends underlying these broad patterns for a select group of liberal arts colleges. These examples highlight how liberal arts colleges tend to significantly improve their value-add ranking over time, especially within the first decade or so after graduation.

What Could Be Driving the Earnings Catch-Up for Liberal Arts College Graduates?
We find that graduates of liberal arts colleges tend to earn less early in their careers but gradually catch up to peers from other institutions. What might explain this trajectory?
Our regressions already control for race, gender, and undergraduate major at the individual level, as well as average SAT scores by institution as a proxy for academic selectivity. Yet the narrowing wage gap over time suggests additional dynamics are at play.
1. Family Income and Wealth
Liberal arts college (LAC) students tend to come from significantly wealthier families than students at other types of institutions (Figure 5). This can influence earnings trajectories in multiple ways, notably through strategic early-career choices: Higher family income allows LAC graduates to accept lower-paying but prestigious early jobs (e.g., in nonprofits, research, or policy), which may yield higher long-run returns.

2. Graduate School Enrollment
Partly because of higher family wealth, graduates of liberal arts colleges (LACs) are far more likely to pursue graduate or professional degrees—a key reason for their delayed earnings growth. As shown in Figure 6, LACs have significantly higher graduate school enrollment rates than other institutions.
Graduate education shapes earnings in several ways. First, advanced degrees—especially in law, business, and medicine—substantially raise earnings after completion.
Second, graduate school enrollment is not random. If high-ability students are more likely to continue their education, early-career data may understate the earnings potential of LAC graduates, since many of their strongest students are temporarily absent from the labor market. As these individuals re-enter the workforce, LACs appear to “catch up” over time.

Other Potential Explanations
Beyond graduate school and family background, several career-related factors may help explain the earnings catch-up observed among liberal arts college (LAC) graduates:
Occupational Transitions: Many LAC graduates start their careers in mission-driven or social-impact roles that pay relatively little. Over time, however, they often move into higher-paying sectors such as consulting, policy, philanthropy, or tech-enabled services—especially as financial pressures grow.
Upward Mobility Within Fields: Even those who remain in lower-paying sectors frequently advance into management or leadership roles (e.g., a teacher becoming a principal or a nonprofit officer rising to executive director), which bring substantial pay increases.
Sector Shifts Without Occupational Change: Some LAC graduates remain in similar occupations but move from nonprofit or public organizations to private-sector roles—such as from a nonprofit policy analyst to a consulting firm—where compensation is typically higher.
Generalist and Transferable Skills That Appreciate Over Time: Liberal arts colleges emphasize broad, transferable skills—such as communication, critical thinking, and interpersonal ability—that become more valuable as careers progress. Even within technical majors, LAC programs tend to stress generalist training over narrow specialization, which may lead to steeper earnings growth over the career lifecycle, consistent with the arguments of Deming and Noray (2020).
Conclusion
Our analysis shows that timing plays a critical role in measuring the value-added of different college types. Liberal arts college (LAC) graduates tend to earn less in the early years after graduation, leading to lower rankings in salary-based comparisons—especially when controlling for student selectivity.
However, these same graduates show substantial earnings catch-up over time, gaining as much as 15 percentile points in ranking by year 15. This lifecycle dynamic reflects several factors such as higher rates of graduate school enrollment, and occupational and sectoral shifts into higher-paying or leadership roles. It may also highlight the growing value of transferable skills developed in liberal arts settings.
In contrast, high-STEM schools deliver strong early returns that level off over time. These findings suggest that rankings based on short-term earnings can misrepresent long-term outcomes, particularly for institutions like LACs whose graduates follow delayed career trajectories.
[1] We define high-STEM schools as private or public research universities that fall in the top quintile of the share of bachelor’s degrees awarded in the following areas (CIP codes): Computer and Information Sciences and Support Services (11), Engineering (14), Engineering Technologies/Technicians (15), Military Technologies (29), Science Technologies/Technicians (41)
[2] With these cohorts and earning years our base analysis is not balanced, but the patterns described here hold true if we restrict to a single group of cohorts to control for potential cohort effects.

College Numbers Down, Degrees Up: Understanding the Post-2010 Enrollment Shift
After peaking in 2010, U.S. college enrollment has fallen by about 2 million—even as degree attainment keeps rising. Our new analysis shows the decline is concentrated in community colleges and for-profits, driven partly by demographics, while four-year enrollment rates and completion—especially at two-year institutions—have strengthened. In this post, we unpack what’s really changing in higher ed and why it matters for students and states.
By Joe Winkelman, Gad Levanon and Mels de Zeeuw
After decades of expansion, American higher education has entered a period of contraction and reconfiguration. From the mid-1960s to 2010, college enrollment nearly quadrupled, reaching a peak of 21 million students. Since then, total enrollment has fallen by two million.
At first glance, this decline seems alarming. But a closer look reveals a more nuanced—and in some ways, encouraging—story.
Most of the decline is concentrated in undergraduate enrollment, particularly at community colleges. Four-year college enrollment has been more stable, and most of its losses came from the collapse of for-profit institutions. Demographics also played a role: as the 18–22 population shrank between 2012 and 2020, overall enrollment fell more dramatically than enrollment rates.
The good news: Enrollment rates at four-year colleges held firm. And thanks to rising completion rates, the share of young adults earning bachelor’s degrees continued to grow.
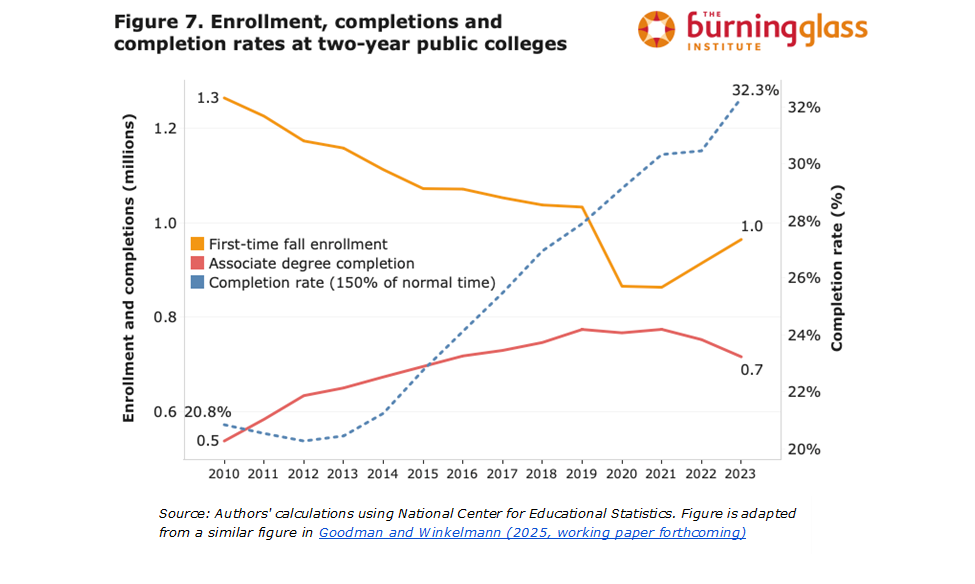
The surprising good news: Despite a steep drop in community college enrollment, associate degree attainment has not declined—because completion rates have improved dramatically.
In the pages that follow, we examine how and why these patterns emerged, with particular focus on the evolving role of community colleges. We also explore what these trends mean for the future.
A long era of enrollment growth came to an end in 2010.
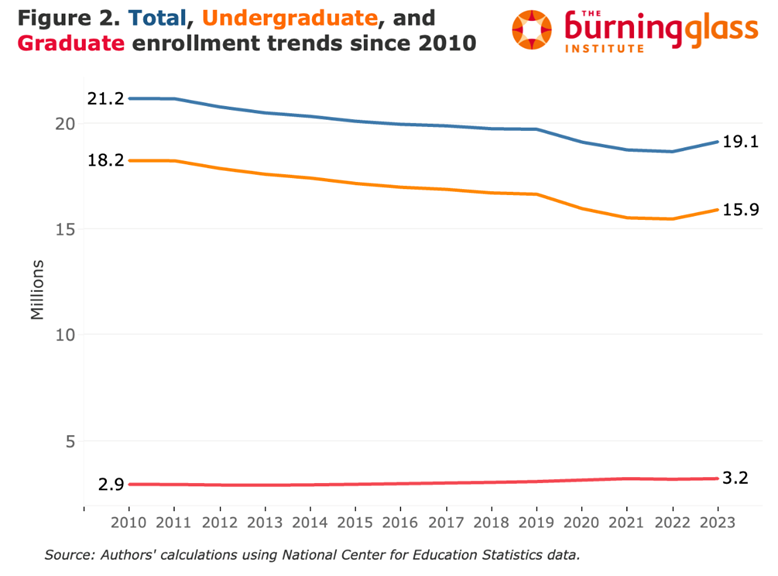
From the mid-1960s to 2010, total U.S. college enrollment nearly quadrupled, rising to a peak of 21 million students at the height of the Great Recession. Since then, the trend has reversed: enrollment declined steadily through 2019, fell more sharply during the COVID-19 years of 2020–21, and has recovered only modestly. In fall 2023, about 19 million students were enrolled—two million fewer than in 2010.imagine

The decline is an undergraduate story The overall post-2010 decline is driven entirely by falling undergraduate numbers. By contrast, graduate enrollment—just under 20 percent of total headcount—has inched upward. From 2010 to 2023, undergraduate enrollment fell from 18.2 million to 15.9 million, while graduate enrollment rose from 2.9 million to 3.2 million. Although the absolute number of graduate students continues to grow, their count has fallen relative to the flow of recent bachelor’s degree recipients, indicating a subtle shift in post-baccalaureate participation even without an outright contraction of the graduate sector.
Community colleges drove the drop, and For-Profits Collapsed
Higher education in the United States spans multiple types of institutions with different primary functions, student profiles, and degree portfolios. Distinguishing among these sectors is essential, because enrollment patterns have diverged across them.
The largest enrollment drop has occurred at public two-year colleges, commonly known as community colleges. These institutions draw predominantly local, often older students, award associate degrees and short-term certificates, and serve as a core component of U.S. workforce development.
Under the official IPEDS definitions, community-college enrollment fell by almost 40 percent, from 7.3 million in fall 2010 to 4.6 million in fall 2023. However, a meaningful share of this drop reflects reclassification rather than real attrition. Many two-year colleges now confer a small number of bachelor’s degrees without substantially altering their program mix. Because IPEDS assigns institutions to sectors based on the highest credential awarded, these schools are re-labeled as four-year institutions, shifting their students out of the two-year tally. Consequently, the apparent decline overstates the true enrollment loss in the community-college sector.
To remove reclassification effects, we follow institutions according to the sector in which they were classified in 2010. Under this fixed definition, community-college enrollment fell by just over 20 percent—from 7.3 million in 2010 to 5.6 million in 2023. The for-profit sector contracted even more sharply, dropping from 1.8 million to 0.6 million students, a decline that coincided with rising skepticism and stricter regulation of for-profit colleges.
In contrast, undergraduate enrollment at four-year institutions has remained relatively stable. Both public and private four-year colleges registered a modest COVID-19 enrollment dip, and the public four-year sector has yet to regain its pre-pandemic headcount.

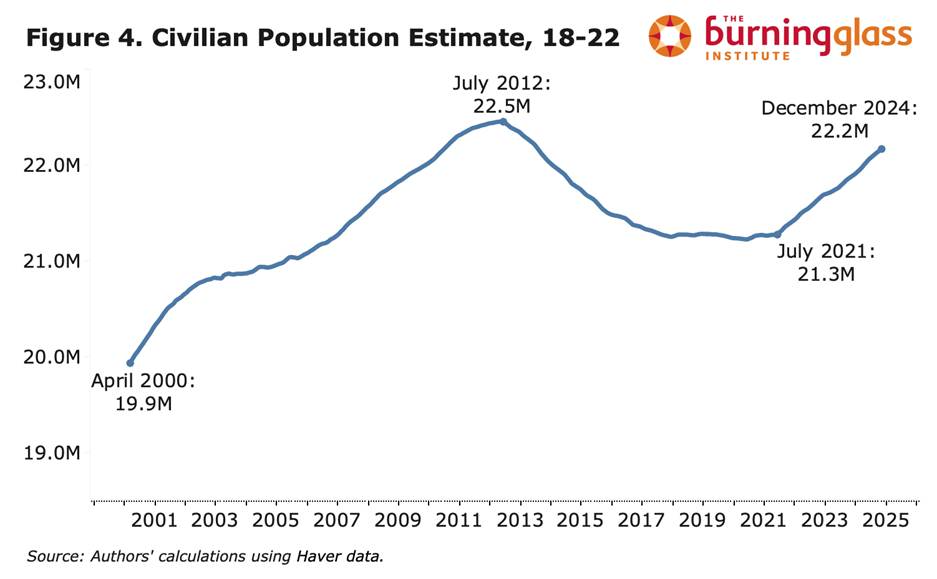
Demographics play a role
One of the biggest drivers of college enrollment is simply the size of the college-going age group. From 2012 to 2020, the number of 18–22-year-olds fell, which mechanically contributed to declining total enrollment.
The rebound you see after 2022 is largely explained by the surge in undocumentedimmigration. But since these young people are much less likely to enroll in college, the growth in headcount doesn’t necessarily translate into higher college enrollment.
4-year college enrollment rates stayed relatively constant. 2-year rates sharply declined.
Household survey data can complement our analysis of institutional enrollment counts and let us adjust for changes in the population’s age structure. Using the Current Population Survey (CPS), we track enrollment among 18- to 25-year-olds. CPS levels are not directly comparable to IPEDS counts: CPS is person-based, whereas IPEDS is institution-based. In addition, two-year enrollment—covering both associate programs and short-term certificates—is typically shorter and more likely to be part-time. CPS sector categories are self-reported rather than administrative, and the survey does not separate for-profit from non-profit institutions.
Despite these measurement differences, the CPS data paint a similar picture: two-year enrollment has fallen, while four-year and graduate enrollment have remained stable. The sharpest shift is a steady drop in the share of young adults attending community colleges. Notwithstanding a small uptick in enrollment at other institution types, most of the community-college decline reflects a rise in 18- to 25-year-olds who are not enrolled at all—a share that, after decades of decline, climbed from roughly 56 percent in 2010 to about 60 percent by 2023.

Degrees earned haven’t fallen with enrollment.
Falling enrollment prompts the question of how educational attainment is evolving—and with it, the future education composition of the labor force. To trace attainment levels, we again turn to household survey data, using the American Community Survey (ACS).
ACS data indicate that educational attainment among young adults has remained stable—and may even be rising. The share of 25-year-olds with only a high-school diploma or less has edged downward, as has the proportion with some college credit but no degree. By contrast, the fraction holding a bachelor’s or graduate degree has increased steadily.

Completion rates rose across the board
Community college enrollment has plummeted over the past decade. But the share of Americans with an associate degree—the credential most closely tied to these institutions—has barely changed. At first glance, that’s a puzzle.
How can degree attainment remain stable when fewer students are enrolling?
A big part of the answer lies in rising completion rates. Among full-time, first-time students in the two-year sector, the share graduating within 150% of program time has increased by more than 50% since 2010. So even with a shrinking pipeline, more students are finishing.
Why have completion rates improved?
At least two forces seem to be at work.
First, colleges got better at helping students succeed. Beginning in the early 2010s, many community colleges embraced a “completion agenda”: streamlining programs, replacing long remedial sequences, boosting advising, and offering practical supports like coaching and transportation. Some states tied funding to completions. Initiatives like CUNY ASAP showed that systemic reform could move the needle.
Second, the composition of who enrolls has likely shifted. As overall enrollment fell, some of the students least likely to finish—those facing greater academic or financial barriers—may have opted out altogether. That would mechanically raise completion rates among those who remain. Completion rates at four-year institutions have also risen in recent years, though the gains have been more modest—partly because rates at these institutions were already substantially higher to begin with.

Recent data suggest a continued recovery in enrollment.
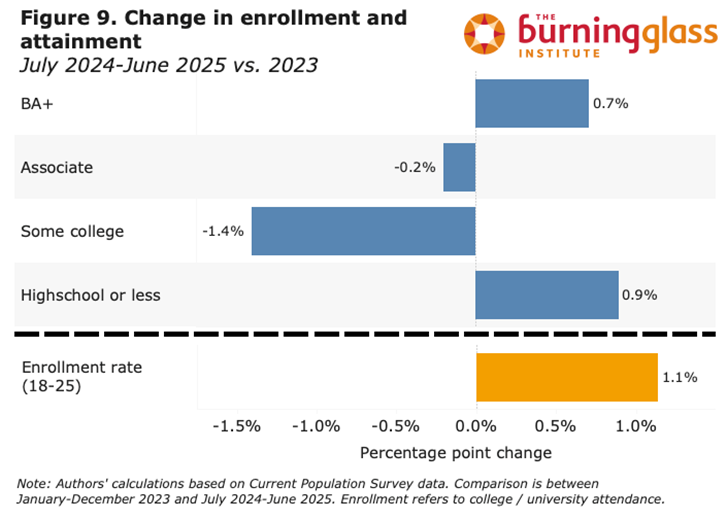
While our most detailed picture of U.S. higher education comes from institution-level IPEDS data, the CPS School Enrollment Supplement, and the ACS, all three sources arrive with a delay of more than a year. To assess more recent trends in college enrollment and educational attainment, we turn to the monthly CPS, comparing 2023 to the most recent 12-month period (July 2024–June 2025).
This analysis suggests that enrollment continues to rebound from its post-pandemic low. The share of 18–25-year-olds reporting current college or university enrollment is up by over one percentage point relative to 2023. However, the monthly CPS does not allow us to distinguish between different institution types (e.g., community colleges vs. four-year universities).
On the attainment side, we see signs of a widening educational split among young Americans. As Figure 5 shows, the share reporting “some college” as their highest level of education has been declining for over a decade—typically offset by more students earning degrees. But recent data suggest a change: while “some college” continues to shrink, about half of that decline is now being absorbed by a growing share of young adults whose highest credential is a high school diploma. This points to a possible post-pandemic stall in educational progression for some students.
Conclusion
Total college enrollment is much lower than in 2010. At first glance, the decline in U.S. college enrollment since 2010 paints a bleak picture. But that characterization is somewhat misleading for several reasons:
1. The decline is overwhelmingly an undergraduate phenomenon, concentrated in public two-year and for-profit institutions. Enrollment in other four-year institutions has remained broadly stable.
2. Demographics played a major role. The size of the 18–22 population shrank from roughly 2012 to 2021, mechanically pulling down total enrollment even though enrollment rates didn’t decline as sharply.
3. Completion rates have improved across sectors—especially in community colleges—reducing the “some college, no degree” group. Despite steep enrollment declines in community colleges, the share of Americans with an associate degree has held roughly steady, because more students are finishing. And the share of young Americans with a bachelor’s degree continues to rise.
Recent data through mid-2025 show a modest post-2023 rebound in enrollment among 18–25-year-olds. Degree attainment continues to inch upward for those with a BA or higher—even as the share with only a high school diploma has also risen slightly. Meanwhile, the “some college, no degree” category has fallen further, suggesting that more students are completing what they start, and fewer are dropping out midstream.
There is no evidence that young adults are becoming less likely to ultimately earn a college degree. Instead, a segment that previously would have enrolled in two-year colleges is choosing not to enroll at all. Given historically low completion rates in that group, some of this shift may reflect more efficient pathways—such as work, apprenticeships, or short non-degree training—rather than lost credentials.
Looking ahead, demographic pressures will intensify. The 18–22 population is set to contract again starting now, as the smaller birth cohorts from the post-2007 baby bust age into college. This will put renewed pressure on enrollment numbers, even if enrollment rates remain flat or improve—intensifying competition for traditional-age students.
An open question is whether the current difficulty many new graduates face in finding jobs they want will dampen interest in four-year colleges—nudging more students toward two-year programs, certificates, or work-first pathways—or instead increase demand for bachelor’s programs that embed stronger work-integrated learning and career placement.

Who’s Still Quitting? The Uneven End of the Great Resignation
By Gad Levanon and Mels de Zeeuw
The quits rate is a key barometer to understand the labor market. It’s a key proxy for labor-market tightness and hiring difficulty, closely watched by employers. Because quits capture how often workers voluntarily leave, they signal how costly it will be for firms to recruit, train, and bring new employees up the learning curve—costs that translate into lost productivity and higher replacement expenses. When quits remain subdued, companies feel less pressure to keep workers happy through higher pay, flexible schedules, or generous benefits, since the risk of losing talent is lower.
Every month the Job Openings and Labor Turnover (JOLTS) survey from the Bureau of Labor Statistics provides data on quits, separations, and layoffs, which allows us a timely look on whether employers are facing a tight labor market, or whether their workers’ employment positions are worsening.
However, while JOLTS is great for national, industry and state trends, it can’t tell us who is doing the switching and doesn’t offer data by occupation, education, age, or race/ethnicity. Building on Bart Hobijn’s approach, we link CPS microdata to JOLTS to estimate quits, layoffs, and total separations for detailed worker groups. That matters because knowing which groups are quitting shows exactly where the pressure is, and where it isn’t.
Methodology
To estimate quits rates by non-JOLTS demographics such as age, occupation, or educational attainment, we use microdata from the Current Population Survey’s monthly survey. We first determine whether workers in each month transitioned from one employer to the next, or from their job into unemployment or out of the labor force; and whether they did so voluntarily or involuntarily. For some respondents we could identify a separation, but not the reason behind it. Quits, layoffs, and indeterminable sum to total separations.
Next, we created monthly averages for these three measures by industry, and anchored these to the equivalent seasonally adjusted JOLTS industry-level metrics to create adjustment factors. For each month and 2-digit NAICS industry combination we apply the factors to the CPS weights so adjusted measures of quits, layoffs, and separations match JOLTS at the industry level. This then allows us to analyze these rates by a variety of other demographic data present in the CPS.
To adjust for low observations counts and seasonal biases, we present results as 12-month moving averages, and omit demographic sub groups with too few observations to draw meaningful conclusions. This does mean turning points may appear with a lag. Finally, we’ve calculated both the rates, as well as the change in these rates from their peak in March 2022 during the Great Resignation, and expressed each month’s value as a percentile of that groups rates over the entire almost 24 year timeframe. We present some of this analysis below.
From the ‘Great Resignation’ back down to reality
As Figure 1 shows, resignations among workers rose steadily during the 2010 through 2019 period, dropped sharply during the COVID recession, before rising sharply and peaking in March 2022 in the period dubbed the ‘Great Resignation’. Since then, the quits rate has dropped steadily before stabilizing somewhat in 2025.
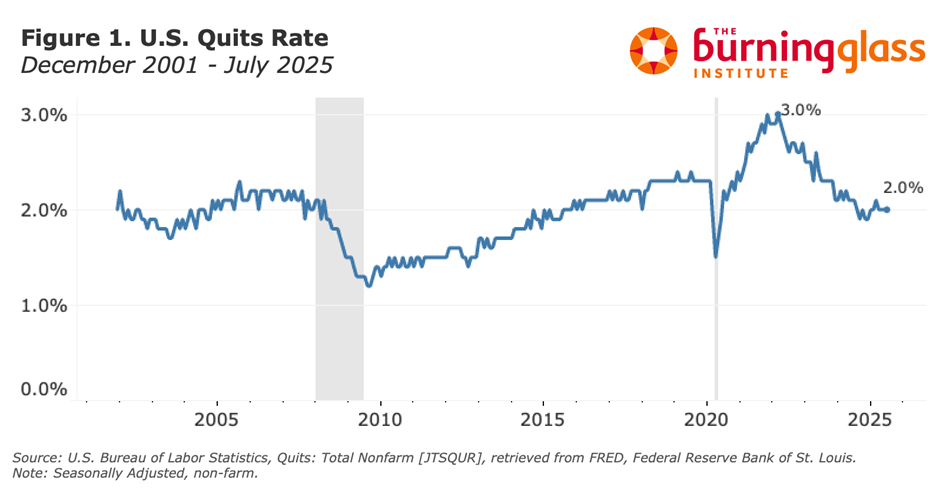
While the quits rate is still well above the lows of the Great Recession, in July 2025 it was below the historical norm, at its 42nd percentile. It remains to be seen whether resignation levels will stabilize or decline further, but clearly workers’ bargaining power has worsened in the past three years. However, as we will show, these declines have not occurred evenly across the board. We find a striking divergence in quits rate trends between young and older workers, between those with lower- and higher educational attainment, and between white- and blue-collar workers.
No country for young bargainers
As figure 2 shows, younger workers exhibit increasingly lower rates of resignation. While quits rates have declined among workers in all age groups, drops have been largest among those below the age of 40. Workers between 16 and 24 years old in particular are experiencing historically tight conditions, with their July 2025 quits rate being among the bottom quartile of the prior two and a half decades, and the lowest since December 2014.

Divergence by educational attainment
Figure 3 depicts trends in quits rates by educational attainment. Workers with less educational attainment have historically elevated quits rates compared to the prior two and a half decades (60-69th percentile). The notable exception occurs among workers with occupational/vocational associate’s degrees, which have a historically smaller churn (45th percentile).
The segment of workers with college degrees have resignation rates that are historically quite low. This is particularly striking among workers with PhDs (3rd percentile), where their quits rate in July 2025 marks one of the lowest months in the past 25 years. The last time the PhD quits rate was this low was April 2014.
It appears retention for Master’s and PhD graduates is currently relatively easy, while though easing it remains comparatively difficult to retain blue-collar workers. Given declining numbers of non-college educated workers, and a growing number individuals who are college educated, we can expect this divergence to persist.

A two-track labor market: diverging occupation trends
As figure 4 illustrates, this historical trend in quits rates shows sharply diverging trends by occupation. Various blue-collar skilled, hands-on, and licensed roles remain historically hot. Quits rates among workers in Protective Services (87th percentile); Installation, Maintenance, and Repair (87th); among Health-care support and Community and Social Service roles (like social workers and counsellors) rates are at their 80th percentile; and among Health-care practitioners they are at their 77th percentile. On the other hand, quits rates are at near-historic lows among white-collar workers in Computer and Mathematical occupations (20th percentile); and in Life, Physical and Social Science jobs (11th percentile).
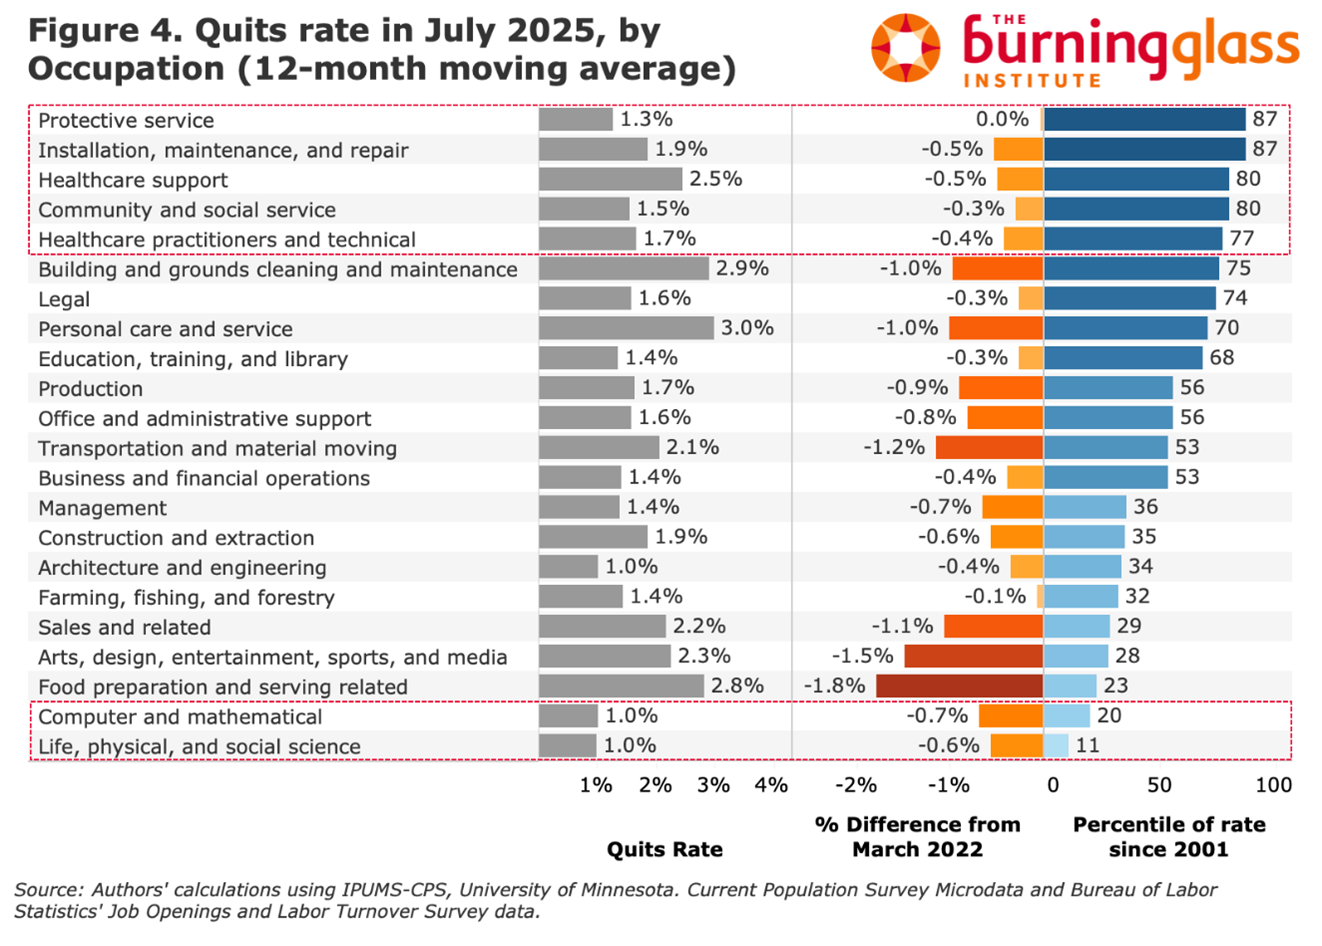
The results show some signs of a two-track labor market, wherein white-collar workers in Computer and Life/Physical/Social Science occupations have some of their lowest resignation rates in the past two decades; whereas conditions are tighter for employers in blue-collar installation and healthcare occupations.
Conclusion
While the Great Resignation is clearly over in aggregate, that conclusion masks important variation across the labor market. In July 2025, the national quits rate stood at around 2.0%, placing it at the 42nd percentile of the past 25 years—a clear sign that overall worker bargaining power has weakened from pandemic-era highs. However, newly developed demographic-specific quits measures—linking CPS microdata to JOLTS benchmarks—reveal a much more uneven picture beneath the surface.
To better capture these divergences, we analyzed not just raw quits rates but historical percentiles, comparing today’s values to each group’s own experience since 2001. This approach highlights whether quits are unusually high or low relative to each group’s history, offering a more accurate view of labor market strength.
Several patterns emerge. Younger workers are quitting at relatively low rates, reflecting historically weak bargaining positions compared to older age groups. Workers with advanced degrees are easier to retain than at almost any point in the past quarter century, while employers continue to face elevated churn among less-educated workers. White-collar jobs show lower turnover, whereas manual and blue-collar occupations still experience heightened churn. These patterns reflect a deeper mismatch in labor supply and demand, particularly across education levels and age groups.
On one side of the labor market, the supply of non-college workers is shrinking. Boomer retirements have been concentrated in blue-collar and manual service occupations, and tighter immigration—especially reduced undocumented inflows—has made replacement harder. College graduates rarely transition into these roles, so the labor pool for occupations in construction, food service, health support, maintenance, and logistics continues to thin. At the same time, demand for manual labor has remained steady—or even strengthened—in many sectors, helping to keep quits historically elevated in these occupations despite broader cooling.
On the other side, the number of college graduates continues to rise. This expanding supply is colliding with technological shifts, as generative AI automates routine analytical tasks and employers become more selective in hiring. Entry-level white-collar jobs have become the margin of adjustment, while employers increasingly favor experienced hires. The result is historically low quits among college graduates, especially those with advanced degrees. However, one puzzling finding remains: workers with graduate degrees are quitting at even lower rates than those with only a bachelor’s degree, a divergence that current explanations—supply growth, automation, or hiring shifts—do not fully account for.

Shifting Demographic and Education Trends and Their Impact on the U.S. Workforce
Boomer retirements are freezing overall headcount, but our research shows a different kind of churn: bachelor’s-degree holders are still climbing while the non-college workforce—especially women in hands-on roles—shrinks fast. That could leave us with surplus grads just as generative AI cools white-collar hiring, and a scramble for nurses, machinists, and carpenters who can’t be automated or offshored.
By Gad Levanon and Frank Steemers
America’s labor market is undergoing a structural shift, and our report projects how this will unfold across gender and education. With Boomer retirements accelerating and immigration only partially offsetting the decline, the working age population is no longer growing. Yet nearly every net addition in the coming years will have a bachelor’s degree.
By 2034, we project that the non-college population will be significantly smaller, while the number of degree holders continues to grow steadily. This raises the risk of a graduate surplus, especially as generative AI dampens white-collar job growth.
The gender dimension makes the imbalance even sharper. Our projections show that college-educated women will continue to surge, while non-college women, the core workforce for care, service, and support roles, decline rapidly. These are jobs that can’t be automated, offshored, or done remotely. As a result, hospitals, factories, and construction sites will face intensifying competition for the shrinking pool of hands-on workers.
The Slow Squeeze on America’s Workforce
It’s well known that the U.S. working-age population (ages 18–64) is barely growing—and that this stagnation will likely persist for at least the next decade. From 2017 onward, annual growth has slipped below 0.2%, a dramatic break from the 1–2% pace that characterized much of the 20th century. The chart shows why.
In the early 2000s, far more 17-year-olds were aging into prime-working age than 64-year-olds were aging out, adding nearly a full percentage point to labor-supply growth. In recent years, As the last Baby Boomers retire and the smaller Gen-Z cohorts replace them, that orange aging line essentially reaches zero.
The red migration line reflects an annual contribution of about 0.15 to 0.20 percentage points in the Census Bureau’s low-immigration scenario. Why focus on the “low” scenario?
This projection comes from the Census Bureau’s 2023 National Population Projections, which offer several immigration pathways. We chose the low-immigration variant to illustrate what could happen if U.S. policy shifts toward a more restrictive approach, similar to the Trump-era policies that sharply reduced refugee admissions and tightened border enforcement. Such a shift is plausible following the surge in undocumented immigration between 2022 and 2024.
The grey line tracing overall prime-age growth slides from more than 1% in 2000 to near-zero through 2035. Under present, low-immigration assumptions, the United States is entering a decade, or more, of flat or shrinking prime-age labor supply.
Chart 1

However, a much less reported, but perhaps more consequential, trend is underway beneath the surface.
The decline in the working-age population (ages 20–64) applies only to those without a college degree. In contrast, the number of working-age people with a bachelor’s degree has been rising consistently and steadily—and is projected to continue growing at 1–1.5% annually through at least 2035 (Charts 2 and 3).
Chart 2
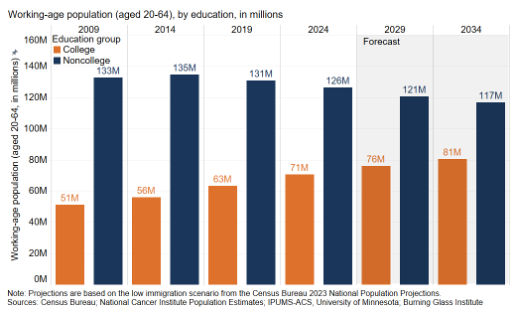
Chart 3
Why? Because the rising generation of young adults is far more likely to hold a bachelor’s degree than the retiring cohorts they’re replacing. That compositional shift is reshaping labor supply, not just in size but in kind.
And it matters. People with a bachelor’s degree typically avoid blue-collar and manual services occupations, roles in transportation, production, construction, farming, maintenance and repair, food services, cleaning, security, personal care, and health support. As a result, the supply of available workers in those roles is shrinking, and will continue shrinking in the decade ahead.
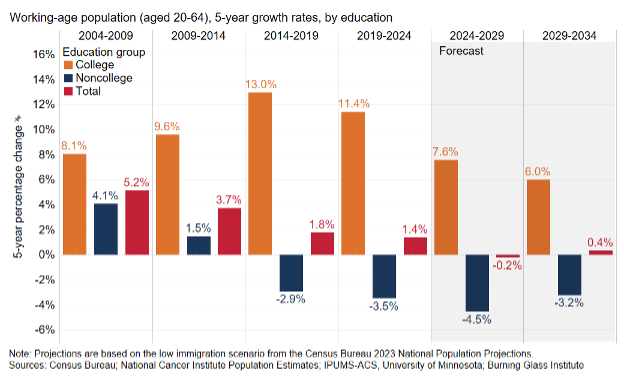
That’s a problem, because demand for blue-collar and manual service workers remains strong and in many cases is rising (Chart 4). Despite the steady expansion of the knowledge economy and white-collar employment, manual jobs have proven far more resilient than many expected.
Chart 4

As a result, in recent years labor shortages were more severe, and wage growth was higher, in blue-collar and manual services jobs than in white-collar ones, a complete reversal from the dominant pattern of recent decades, where employers struggled most to hire workers with college degrees.
Chart 5
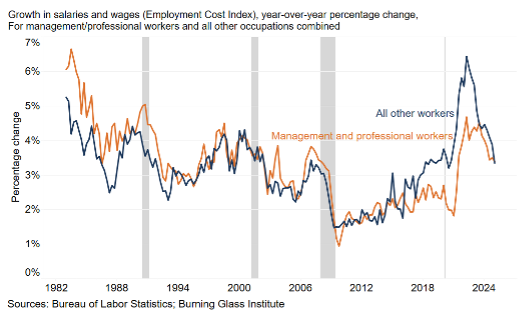
Yet that backdrop of demographic scarcity collides with another force moving at rapid speed: generative AI and other productivity improving factors are starting to erode the very white-collar headcount that once seemed scarce.
For the labor market this means that a continuation of the existing trend: the pinch point will be blue collar and manual services jobs. Jobs our aging population still needs but AI can’t yet nail, while many college-pathway office jobs will see slower hiring and flatter wages. Over time that shift could further compress the college wage premium.
A Gender Divide: Steeper Declines Among Non-College Women
The shrinking non-college workforce is being driven disproportionately by women. Over the past decade, the number of working-age women without a bachelor’s degree has declined far more steeply than men. Projections suggest this gap will widen, creating growing imbalances in frontline service jobs that rely heavily on non-college female labor.
At the same time, women continue to outpace men in higher education. College-educated women now significantly outnumber college-educated men—and that lead is expected to grow.
This shift has major implications. As non-college women exit the labor pool, care-focused sectors like healthcare support, childcare, and personal care face acute staffing pressure. These hands-on roles can’t easily be automated and will need to adapt—by boosting wages, improving job quality, or expanding recruiting pipelines—to keep up with demand.
Chart 6

Conclusion
Demography and education are steering the labor market toward an odd equilibrium: too many degree holders, too few hands-on workers. Employers in transport, trades, and care will confront chronic vacancies and rising wages, spurring automation and pressuring policymakers to expand vocational pathways, immigration, and participation incentives. Conversely, an oversupply of graduates, particularly women, could flatten starting salaries The gender wrinkle matters: frontline sectors most starved for labor draw heavily from the very group of non-college women disappearing fastest.
Methodology for the Population Projections by Education
This analysis creates education-specific population projections using a methodology consisting of three main components:
Population Data Integration and Calibration
The analysis begins by integrating historical population estimates from the U.S. Census Bureau (through 2024) with the official 2023 national population projections. These datasets are harmonized using a growth rate calibration function that ensures smooth transitions between the historical and projected periods while maintaining consistency with the most recent available data. The analysis relies on the “low” immigration projection scenario.
Education Data Distribution
Educational attainment patterns are derived from the American Community Survey, which provides information on educational attainment by age, sex, and year. The analysis classifies education into two categories: below BA and BA and above. Education shares are calculated for each 5-year age group and gender up to 2024.
Projection Approach
The analysis employs two complementary projection methods, each suited to different age groups and time horizons:
Cohort Change Ratio (CCR) Method: Applied to older age groups (30+ years), this method tracks how each 5-year age/gender/education group evolves as cohorts age over 5-year periods. The CCR is calculated as the ratio of the population in each group in 2024 (e.g., women with a BA aged 45–49) to the same cohort’s size in 2019 (e.g., women with a BA aged 40–44). The observed pattern (CCR 2019–2024) is applied to estimate the education-specific population in 2029 and 2034.
Constant Method: Used for younger age groups (under 30), this approach assumes that education shares remain constant after 2024. This reflects the reality that many younger individuals have not yet completed their education. The CCR method for these younger age groups was found to be too volatile.
The resulting education-specific population estimates are then calibrated to match the total population projections from the Census Bureau, ensuring consistency with official demographic projections.

Brains From Abroad: How U.S. Regions Compete for STEM Talent from Asia
For U.S. metro areas aspiring to grow as centers of innovation, the ability to attract highly educated international workers is not a luxury—it’s a necessity. Highly educated professionals from Asia now comprise a substantial share of the STEM workforce in leading American metros. At the Burning Glass Institute, we set out to quantify just how significant these workers are—and to proxy for the quality of the human capital they bring to different parts of the country. No other public source offers this kind of granular view at the national level of talent educated in Asia.
For U.S. metro areas aspiring to grow as centers of innovation, the ability to attract highly educated international workers is not a luxury—it’s a necessity. Highly educated professionals from Asia now comprise a substantial share of the STEM workforce in leading American metros. At the Burning Glass Institute, we set out to quantify just how significant these workers are—and to proxy for the quality of the human capital they bring to different parts of the country. No other public source offers this kind of granular view at the national level of talent educated in Asia.
We defined "Asia-educated" workers as individuals whose first bachelor's degree was from one of the 501 Asian universities featured in the QS World University Rankings. We then tracked the profiles of Asia-educated workers who are currently based in the U.S., identifying their locations by metropolitan statistical area (MSA).
To create a measure of talent quality, for each MSA, we computed a weighted average of the Asian universities QS rankings represented. Importantly, we adjusted this metric by controlling for the occupational mix of the Asia-educated workforce in each metro. This allowed us to avoid over-representing MSAs with a high concentration of tech or finance roles—industries that tend to attract graduates from more prestigious institutions in Asia.
Our findings show some clear patterns. In places like San Jose metro area, nearly one in five degree-holders were educated in Asia. Among tech workers, the figure rises above one in three. These professionals are not only numerous, but they are also highly credentialed, with many graduating from top-ranked institutions across Asia. While not to the same extent as Silicon Valley, tech hubs like the Bay Area and Seattle also rely heavily on highly credentialed talent from Asia.
But our data shows that other regions are clearly falling behind. In metros such as Miami—as well as much of the South and the Midwest, the share of STEM workers educated in Asia is lower, and the average ranking of their alma maters lags well behind that seen in coastal tech hubs.
The presence of Asia-educated workers follows clear regional patterns, with significant concentrations in both well-established tech hubs and some less expected manufacturing and academic centers. This uneven distribution reflects—and has the potential to reinforce—wider regional disparities. Areas that can integrate into global talent networks today will extend their lead in innovation and growth in the future. Others risk falling further behind.
Table 1 – Top 20 Asian universities according to QS World University Rankings

Mapping Asia-educated college grads in the U.S.
Asia-educated workers in the U.S. are primarily concentrated in the West and Northeast. Leading the way is Washington State, where 5.7% of all workers with at least a bachelor's degree were educated in Asia. California follows closely at 5.3%, with New Jersey, Massachusetts, Delaware, and New York hovering around 3%. These concentrations reflect regional economies that attract skilled talent in specialized industries. Texas follows with a share of 2.7%.
Figure 1

Asia-educated talent powering U.S. tech hubs
Zooming in from the state to the metro are level, tech-heavy regions stand out as prime destinations for Asia-educated professionals. Silicon Valley leads the pack: in the San Jose–Sunnyvale–Santa Clara metro, 18.7% of degree holders obtained their first BA from an Asian university. Other major tech hubs also rank high—8.3% in San Francisco–Oakland–Fremont and 7.1% in Seattle–Tacoma–Bellevue. A key driver of this pattern is the dominance of computer and mathematical occupations in these regions. Between 21% and 36% of tech workers with a degree in these MSAs were educated in Asia at the undergraduate level, underscoring the talent demands of major technology firms (see Figure 3).
Just as important, the average rank of their alma maters is significantly above average (see Figure 4), underscoring that Silicon Valley is importing not only numbers but top-tier credentials. In the tech centers of New York and Boston, the share of Asia-educated workers in computer and mathematical occupations is less than half that of San Francisco or Seattle, and about one third that of San Jose’s. Similarly, the average rank of the Asian universities attended by workers located in those metros tends to be somewhat lower (see Figure 4). New York and Pittsburgh stand out as the two East Coast’s metro areas with the highest quality scores. Boston, Providence and Baltimore rank lower (see Figure 4).
The South, however, scores even worse on our university attended quality score. While Texan metropolitan areas like Austin, Dallas, and Houston show shares of Asia-educated tech workers on par with that of the East Coast’s hubs—ranging from 2.8% to 3.4% (see Figure 2)— their average quality score is lower. Atlanta fares even worse. Finally, among large metros with a noteworthy tech presence, Miami is the outlier. Only about 1.0% of tech workers in the metro are Asia-educated, and those who tend to have attended lower-ranked Asian universities as well.
The Midwest shows a similar pattern to most of the South, with generally low shares of Asia-educated workers across most states (see Figure 1). Illinois leads the region at 2.2%, but Michigan, Ohio, Indiana, and Minnesota all fall below the national average of 2.3%. While Chicago stands out as a partial exception, most of the region struggles to attract Asia-educated STEM talent—both in numbers and in the average rank of universities they attended. A few places buck the trend—Columbus, IN and college towns like West Lafayette and Ann Arbor—but for much of the Midwest, limited access to global talent could constrain future innovation and growth.
Figure 2

Figure 3

Beyond software: Asia-educated talent in engineering
The picture shifts only slightly when we move away from computer and mathematical occupations and focus on architecture and engineering occupations—a category that includes STEM roles such as architects, aerospace engineers, and industrial engineers. These are professionals who may be involved in actual manufacturing processes but are just as likely to work in R&D, product design, prototyping, or other non-manufacturing functions. Once again, Silicon Valley, the Bay Area, and tech hubs like Austin feature prominently. Asia-educated individuals account for 30.1% of all architecture and engineering workers in the San Jose metro, 16.0% in the San Francisco-Oakland-Fremont area, and 10.6% in Austin (see Figure 3). As highlighted before, while Silicon Valley mainly attracts talent educated in top Asian universities, this is less true for Austin. With a share of only 5.7% Seattle appears much further down the list this time, making it a secondary hub for engineering jobs. The engineers who do move to Seattle though tend to come from highly ranked Asian universities (see Figure 4).
Figure 4

Looking beyond the top three MSAs by share of Asian-educated talent working in architecture and engineering, Portland, Detroit, Sacramento, and Phoenix stand out, with shares of Asia-educated talent making up from 6.8% to 8.7% of the local architecture and engineering workforce (see Figure 3). Of those metros, only Portland fares relatively well also on our quality score—as proxied by the average QS ranking of the universities they attended—performing on par with L.A. or Boston (see Figure 4). The other engineering hubs—namely Detroit, Sacramento, and Phoenix—tend to attract talent coming from lower-ranked Asian universities. This reflects how both traditional and up-and-coming advanced manufacturing hubs rely on technical talent educated in Asia. Portland and Phoenix are now established semiconductor manufacturing hubs, while Phoenix is also home to the headquarters of onsemi (ON Semiconductor Corporation). Detroit, for its part, has long been a national center of automotive engineering and manufacturing. Sacramento, while less industrial, plays a key role in public infrastructure, energy systems, and aerospace.
Beyond large metros: unique regional specializations
While large metros and major tech hubs consistently rely on Asia-educated talent to fill their STEM roles, many smaller metro areas with distinctive economic profiles have also emerged as magnets for this workforce. Columbus, IN is a striking example: graduates of Asian universities make up 8.6% of its college-educated workforce—a higher share than in the Bay Area or Seattle (see Figure 5). What’s driving this? Columbus is home to the global headquarters of Cummins Inc., a major player in engine manufacturing and power technologies. That helps explain the unusually high demand for engineering talent. Nearly half (46.1%) of Asia-educated workers in Columbus are employed in architecture and engineering occupations—the highest concentration across all metro areas. While Columbus punches above its weight when it comes to the share of Asia-educated talent, it scores below average on our quality score.
Figure 5

Figure 6

Another noteworthy pattern emerges in college towns. In metros such as Champaign-Urbana, IL (University of Illinois), Trenton-Princeton, NJ (Princeton University), Lafayette-West Lafayette, IN (Purdue University), Ithaca, NY (Cornell University), College Station-Bryan, TX (Texas A&M), State College, PA (Penn State University), Ann Arbor, MI (University of Michigan) and Ames, IA (Iowa State University) Asia-educated workers make up between 4.1% and 7.5% of the college-educated workforce (see Figure 5). That’s higher than in large metros like New York or Boston, and only slightly below levels seen in Seattle or San Francisco. Unsurprisingly, the presence of world-class academic institutions is a major driver: roughly one in two Asia-educated workers in these college towns are employed in academia. The academic pull is also visible in terms of quality: places like Ithaca, Champaign-Urbana, and Ann Arbor attract Asia-educated workers from top-ranked universities, on par with those found in major tech hubs like San Francisco or Seattle (see Figure 6). This reinforces a broader theme: specialized industries and elite research institutions—even outside traditional tech corridors—can exert a strong gravitational pull on international talent.
Conclusion
For American regions hoping to compete as tech and innovation hubs, attracting highly educated international talent isn’t optional—it’s essential. Professionals who earned their undergraduate degrees at Asian universities now make up a significant share of the STEM workforce in leading metros.
In San Jose, nearly one in five college-educated adults—and over one in three tech workers—earned their first degree in Asia. These workers tend to be also highly credentialed, generally graduating from top-ranked institutions. Similar patterns appear in Seattle and San Francisco, where global talent pipelines have become core to regional competitiveness.
Other regions are falling behind. In places like Miami and across much of the South the share of Asia-educated STEM workers is lower, and the average ranking of their alma maters lags well behind the coasts. Texas metros like Austin and Dallas perform somewhat better on volume, but still trail in quality.
The Midwest follows a similar pattern. While Illinois edges above the national average, most of the region struggles to attract Asia-educated STEM talent at scale—and from top institutions.
In several states, policymakers are pairing global talent pipelines with local inclusion strategies. Recent actions include formally recognizing Lunar New Year, Diwali, and other Asian cultural holidays and hosting public celebrations; directing grant funding to AAPI community-based nonprofits; enacting stronger anti-Asian-hate statutes and reporting systems; appointing Asian Americans to cabinet-level or agency leadership roles; and expanding state scholarships, trade missions, and university partnerships with Asia.
These measures both signal welcome and help sustain the qualified talent described throughout this report. They are also likely to further exacerbate the sorting of Asians in certain metros and states. This uneven distribution reflects—and reinforces—wider disparities in innovation capacity. Regions that build deeper ties to global talent networks will extend their lead. Those that don’t may find it harder to compete in the economy of the future.

The Case of the Vanishing Teller: How Banking’s Entry Level Jobs Are Transforming
By Katherine Townsend Kiernan
The financial services industry is undergoing a seismic transformation. Traditional roles, particularly entry-level positions like bank tellers, are being replaced by hybrid roles that demand advanced digital literacy, complex problem-solving, and sophisticated interpersonal skills. This transformation has troubling implications for the workforce, especially for workers without college degrees, who have historically been concentrated in roles most vulnerable to automation. But with challenge comes opportunity, especially for workers who can develop the right blend of technical and interpersonal skills. Through targeted training programs, policy interventions, and cross-sector partnerships that focus on developing skills, we can create pathways for upward mobility in a dynamic and unpredictable labor market environment.
Who Gets Left Behind: The Vanishing World of Bank Tellers
The role of the bank teller has been quietly fading through a slow shift driven by digital banking, mobile apps, and automation—reshaping which human skills are valued and where opportunity lies. While more than 340,000 teller positions still exist, employment in the role has declined nearly 30% since 2010, and job postings have dropped by almost two-thirds. Tellers today also struggle to climb the career ladder: only 4% transition into higher-paying roles like loan officers. As this entry-level gateway disappears, so do the career pathways that have long supported workers without a four-year degree.
Figure 1. Job Postings for Teller Positions

Source: BGI Analysis of Lightcast Job Postings, 2010-2024
Customers now increasingly demand "human-less" banking experiences for routine transactions, pushing financial institutions to radically redesign customer interactions. In response, two new roles—Relationship Bankers and Universal Bankers—have emerged. These positions reflect a nuanced reality: while human-to-human interaction remains essential, the nature of that interaction has transformed. As their name suggests, these roles are more involved than the original teller role that they are in many ways replacing. Universal and Relationship bankers are expected to know more about lending measures and be able to sell banking products to customers in a way that tellers were generally not expected to do.
No longer focused on cash handling, these roles demand sophisticated skills in digital navigation, product understanding, and interpersonal engagement—bearing little resemblance to the transactional work typical just a decade ago. Yet even these emerging roles reflect the harsh economic realities facing early-career workers in financial services. When these roles first emerged in the early 2010s, they commanded nearly $70,000 annually. Today, median wages are around $52,000–a decline of around one-quarter.
Figure 2. Evolution of Teller Skills - Traditional vs. Emerging Roles
Source: BGI Analysis of Lightcast Job Postings Data 2010 - 2024
Career Mobility and Barriers to Advancement
In 2023, financial services employed over 7 million workers across roughly 23 occupations focused on finance, with 10 of those occupations accessible without a four-year degree. These 10 roles employed 3 million workers—about 43% of the industry's total workforce—with an average salary of $49,513. Accounting for nearly 5% of total financial services industry employment, the teller role seemed a good entry point for workers without degrees to launch a career in financial services. The numbers back this up: 64% of tellers are promoted within three years, according to Burning Glass Institute analysis.
Clicking a level deeper, a more nuanced picture emerges. Many promotions are often semi-lateral moves within the teller occupation (e.g., Teller to Senior Teller). And while the most lucrative transitions are to Personal or Relationship Banker, earning a wage premium of up to $18,000, most only lead to increases of about $6,750 annually, bumping workers to annual salaries of $32,500. If tellers were able to bridge the gap between their current occupation to some of the higher paying non-BA finance roles, their salary potential would double: Tellers who get promoted into a new occupation see new salaries of roughly $68,000 on average. These roles include Loan Officers, Auditors, Financial Specialists, and New Account Clerks.
A look at the data for those advancing to higher-paying occupations highlights educational attainment as a major barrier to mobility for tellers, 83% of whom do not have a bachelor's degree. Of the eight most common roles tellers transition into, most usually require a degree. While some occupations—like Financial Specialists and Sales Representatives—have a more balanced distribution of workers with and without bachelor's degrees, the pattern is clear: roles requiring higher education offer substantially higher wages. The two transitions that do not require additional formal education pay dramatically less than those demanding a college degree. This suggests that salary progression in financial services is systematically constrained by educational requirements.
Figure 3. Pathways in Finance Limited by Education Barriers

Source: BGI Analysis of Worker Career Histories; National OEWS; Lightcast Job Postings (2023)
The Fintech Revolution: A Mirage of Opportunity
The rapid growth of financial technology has been consistently portrayed as a democratizing force—a sector promising unprecedented career mobility for workers without traditional four-year degrees. This narrative suggests that coding bootcamps, online learning platforms, and technical certifications could rapidly transform entry-level workers into high-earning tech professionals.
But despite the industry's reputation for disruption, 76% of FinTech workers hold bachelor's degrees, and the sector remains dramatically smaller than traditional banking. Indeed, while about 1 in every 4 workers in FinTech (not including customer service/call center reps) do not have a BA, all the occupations in the sector typically require one. In corporate banking roles, most of the occupations typically require a degree, but roughly 1 in 3 people do not have a degree, indicating a greater opportunity for skills-based transitions in this area of banking. Corporate banking is seven times larger than FinTech, while branch banking is eight times its size. Moreover, employers remain skeptical of non-traditional training, frequently defaulting to degree requirements as a proxy for skill verification. The result is a sector that promises radical opportunity but predominantly reproduces existing educational and professional gatekeeping mechanisms.
Figure 4. Sub-BA employment by sub-sector

Skills as Workforce Adaptation Strategy
The challenges facing bank tellers are not an isolated phenomenon. As digital innovations systematically redesign traditional roles, the skills required for career success are fundamentally changing. The teller's journey—from a transactional, cash-handling position to a more complex role demanding digital literacy and sophisticated interpersonal capabilities—serves as a critical case study in workforce adaptation.
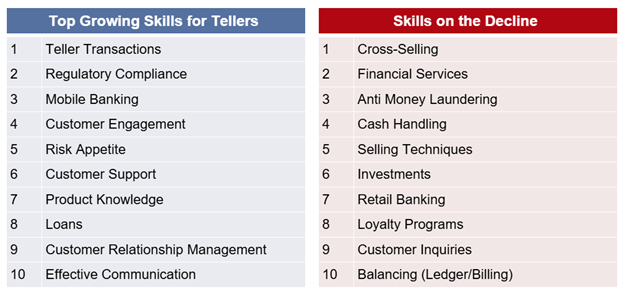
This evolution reveals a pivotal insight: success in the modern financial services landscape no longer depends on performing routine tasks, but on developing a dynamic, integrated skill set that can navigate rapid technological change. Emerging positions are increasingly centered around communications and sales practices—skills that develop through experience and don't necessarily require structured educational or technical training. Nevertheless, some technical skills remain highly valued: skills in mobile banking and data analytics have a growing importance within the financial sector, offering professionals a 37% wage premium. But the most promising career trajectories emerge at the intersection of technical skills and sophisticated interpersonal capabilities.
Figure 5. Key Skill Characteristics

Source: BGI Analysis of Lightcast Job Postings
Spotlight on Hispanic Workers in Financial Services
The technological transformation of financial services intersects critically with workforce demographics, presenting both challenges and opportunities for Hispanic professionals. Currently representing 17.3% of the financial services workforce—slightly below their 19% share of the overall US workforce—Hispanic workers are disproportionately concentrated in roles most vulnerable to technological displacement.
Hispanic workers are overrepresented in positions like tellers, which are rapidly declining due to automation and digital banking trends, while simultaneously being underrepresented in higher-paying roles like loan officers. The representation numbers are revealing: tellers are 21% Hispanic (rising to 28% at five top retail banks), while loan officers are just 13% Hispanic (15% at top 5 banks).
Wage data further underscores these economic barriers. Most finance occupations earn between $50,000 and $75,000 annually, but higher-earning banking positions show significantly lower representation of Hispanic workers. For Hispanic professionals, particularly those historically concentrated in entry-level banking roles, emerging skill-based pathways represent more than career transitions—they offer a strategic approach to economic advancement, circumventing traditional educational barriers and creating more resilient professional identities.
Figure 6. Major Finance Occupations by Annual Salary and Share Hispanic

Source: U.S. Bureau of Labor Statistics. Current Population Survey, Household Data, Annual Averages, Table 11: Employed Persons by Detailed Occupation, Sex, Race, and Hispanic or Latino Ethnicity. https://www.bls.gov/cps/cpsaat11.htm.
U.S. Bureau of Labor Statistics. National Occupational Employment and Wage Statistics (OEWS). U.S. Department of Labor. https://www.bls.gov/oes/tables.htm.
Looking Ahead
As technological advancements continue to reshape industries, the transformation of roles like bank tellers serves as a powerful example of how workforce adaptation is crucial for economic survival. Economic survival now depends on viewing skills as portable assets rather than sector-specific credentials. In an era of technological disruption, skills must become the primary currency of career advancement, particularly for workers without traditional educational credentials. The skills gap—while a significant challenge—also represents an opportunity: by focusing on upskilling and reskilling, we can unlock new pathways for workers, particularly those without traditional college degrees, to advance in their careers.
Workers must become adept at translating their capabilities across multiple professional domains, with workforce development systems providing the critical infrastructure to support these transformations.
To realize this potential, workforce development systems must evolve. Employers, policymakers, and educators must collaborate to build an infrastructure that fosters continuous learning, identifies emerging skill needs, and creates pathways for career progression that are flexible and accessible. Targeted training, strategic policy interventions, and cross-sector partnerships are critical to bridging the gap and ensuring that workers are equipped to thrive in a technology-driven economy.
As we look toward the future, the success of this transformation will be determined by our ability to adapt not just to technological change, but to the evolving needs of the workforce. By prioritizing skills development, we can create a more resilient, equitable labor market that empowers workers to transition seamlessly between industries and roles, ensuring long-term economic mobility and growth.

How Changing College Majors Are Reshaping the Future Workforce
Today’s students are making strategic choices that align with a fast-changing labor market — but sharp declines in fields like education, social work, and the humanities raise red flags for our society’s future. This deep dive explores what shifting college major trends reveal about economic opportunity, societal priorities, and the risks ahead.
By Gad Levanon and Tomer Stern
The college majors that undergraduates have declared in recent years are a leading indicator of where tomorrow’s talent will flow. When those preferences shift, the effect ripples through graduate-school pipelines, corporate recruiting, and ultimately the occupational structure of the economy. To isolate that effect, we ran a controlled thought-experiment: if the only change that occurred between 2018 and 2023 was in students’ majors, how would the mix of occupations shift?
Using American Community Survey micro-data, we compared the major distribution of recent graduates in 2018 and 2023 and applied a fixed 2023 major-to-occupation cross-walk—built from employed 30- to 32-year-olds—to each cohort. Everything else (demographic composition, population size) was held constant. The result is two hypothetical workforces: one reflecting the 2018 major mix and one reflecting 2023. The gap between them pinpoints where talent pipelines are expanding or shrinking solely due to student choice.
One key theme emerges: students are pivoting into majors aligned to high paying careers. Many are flooding into technology, engineering, and advanced health sciences, even as they retreat from less lucrative majors like education, social work, and journalism – as well as the humanities more broadly. On some level, this reflects understandable concerns about employability in an increasingly precarious job market for new grads and ever-rising tuition costs. At the same time, some of the majors in decline portend future shortages in teaching, caregiving, and civic leadership, and may weaken society’s ability to navigate human challenges in an AI-driven world.
These changes will have significant implications for the supply of workers by occupation. Here are some notable examples:
The surge in computer-science enrollment—up 52 percent since 2018—translates into roughly one-fifth more software developers and cybersecurity analysts in the coming pipeline.
Engineering talent is broadening, not just deepening. Double-digit increases in biomedical, aerospace, industrial and mechanical majors signal a robust stream of skills for advanced-manufacturing, climate-tech and space-systems roles.
Health-care projections are mixed. For example, while nurse-anesthetist and nurse-practitioner supply is set to expand by 15–22 percent, the ranks of occupational and physical therapists are on course to fall about 10 percent.
Teacher preparation is moving the wrong way. A continued slide in education and humanities majors implies a 7–9 percent drop in new K-12 and special-education teachers, tightening shortages that districts already struggle to fill.
Humanities and journalism decline thin the creative pipeline: future editors, writers and reporters could shrink by up to one-fifth.
Finally, social-service talent contracts, pointing to a 4 percent dip in child- and family-social-worker supply—small in percentage terms, but critical given the shortages in these occupations.
The Rise of Tech and Health Majors
To quantify the change in major preferences, using American Community Survey micro-data, we compared the major distribution of college graduates aged 22-24 in 2018 and 2023, and computed the percent change in the share of each major.
Two groups of college majors have seen especially large increases in popularity over the past five years: technology and health-related fields. These shifts reflect how today’s students are responding to some of the most powerful forces shaping the U.S. economy and society — from the rise of artificial intelligence and data science to the aging of the population and the lasting impact of the COVID-19 pandemic.
Technology majors, particularly computer and information sciences, have surged. This category saw the largest increase in share among all major groups, growing by 42% from 2018 to 2023. Within that, computer science alone rose by an impressive 52%, underscoring the economy-wide shift toward digital skills and the growing appeal of careers in tech, data, and AI. Engineering also saw a notable uptick, driven by demand for applied technical skills across industries.
Health-related majors expanded significantly as well. Nursing grew by 32%, public health by 29%, and biomedical engineering by a striking 48%. General medical and health services majors increased by 19%. These trends reflect not only the shock of the pandemic but also long-standing demographic shifts — particularly the aging of the baby boomer generation and the growing demand for health care services.
Some of the most dramatic growth occurred in biology and mental health–adjacent fields. Neuroscience majors nearly doubled (+85%), while microbiology (+69%) and biochemical sciences (+63%) also saw exceptional gains. These increases likely stem from a mix of heightened awareness of infectious diseases, rising concern over mental health, and rapid advances in biomedical research and innovation. For many students, these majors represent a blend of cutting-edge science and meaningful societal impact.
Together, these shifts show how student interests are increasingly aligned with future-facing sectors of the economy — and how the classroom is already adapting to a changing world.


The Decline of Humanities, Pure Sciences, and Service Fields
While technology and health majors have surged, other areas of study have seen sharp declines — especially in the liberal arts, some hard sciences, and traditional service professions.
Liberal arts and humanities majors have experienced some of the most significant drops. From 2018 to 2023, the number of students majoring in liberal arts and humanities fell by nearly 30 percent. Area, ethnic, and civilization studies declined by 39 percent, while English language and literature dropped by 15 percent and foreign languages by 16 percent. These fields, once considered the intellectual foundation of a college education, are increasingly seen as disconnected from clear career outcomes.
The decline in humanities enrollment reflects more than changing student preferences—it raises questions about the future role of these disciplines. Fields like history, literature, and philosophy have long developed critical thinking, ethical reasoning, and cultural understanding—skills that contribute to both personal growth and democratic life. As artificial intelligence automates more technical tasks, human skills like creativity, empathy, and judgment may become more valuable, not less. These are often cultivated through the humanities. While the shift toward career-focused education is understandable, maintaining space for the humanities could help ensure society remains thoughtful, adaptable, and equipped to meet the challenges of an AI-driven world.
The hard sciences have not been immune to this trend. Majors in chemistry and mathematics declined by 19 percent and 26 percent, respectively. Although these fields are part of the broader STEM category, they are more academically oriented and less directly tied to the booming tech and health sectors that dominate today’s labor market. Many students may be opting instead for applied disciplines like computer science, data science, or biomedical engineering, which offer more immediate and lucrative job prospects.
The Decline of Education Majors
Majors in education are also on the decline. Education administration and teaching saw an 8.8 percent drop during this period — a relatively modest decline compared to other fields, but still notable given the critical need for educators across the country. The projected decline in teacher supply is partly driven by a decrease in women choosing education-related majors. This trend coincides with a shift towards greater gender parity in traditionally male-dominated fields like management, finance and computer science.
The projected decrease in the population aged 5-19 could lead to slower growth in teacher employment, potentially discouraging students from pursuing teaching careers. In addition, teaching is not attractive to workers who want to work from home.
Finally, the COVID-19 pandemic brought intense pressures on teachers, including burnout, political scrutiny, and staffing shortages. These factors may have made the profession less appealing, even to students motivated by a desire to make a difference.

Even some traditionally career-oriented majors have seen steep declines. Social work dropped by 18 percent, journalism by 31 percent, and pre-law and legal studies by 32 percent. Nutrition sciences fell by 39 percent, and treatment therapy professions declined by 41 percent.
Implication for labor supply by occupation
Shifts in students’ major choices are quietly reshaping the future occupational landscape. By linking each major to the jobs graduates typically enter—using a consistent 2023-based major-to-occupation crosswalk—we can translate changes in educational preferences into projected changes in the workforce. We apply this mapping to the distribution of majors among recent college graduates in both 2018 and 2023, generating two snapshots of what the future labor market might look like if educational trends alone were driving change. This approach doesn’t aim to forecast job openings or total employment. Instead, it isolates how evolving academic interests could tilt the occupational mix, revealing which types of jobs are gaining or losing ground as a result.
The computer and tech sector stands out as the biggest winner. Occupations like Information Security Analysts (+24.4%), Software Developers (+20.5%), and Computer Hardware Engineers (+36.6%) are projected to grow substantially as more students gravitate toward computer science and data-related majors.
Engineering occupations are also benefiting from this trend. Biomedical, aerospace, and industrial engineering roles are all expected to see double-digit growth due to sustained interest in engineering degrees. Even traditionally stable fields like mechanical engineering are seeing positive momentum, reflecting the broad appeal of engineering as a career path.
In the healthcare sector, there’s a sharp divide. Advanced practice roles such as Nurse Anesthetists (+21.9%), Nurse Practitioners (+15.2%), and Podiatrists (+14.6%) are growing strongly, likely due to increasing enrollments in health sciences and pre-med programs. The increase in psychology and neuroscience majors is likely to increase the supply of psychologists.
At the same time, other critical health roles like Occupational Therapists (−8.7%), Physical Therapists (−9.8%), and Dieticians and Nutritionists (−19.8%) are on the decline.

The outlook is more troubling in the social services and education fields. Social work occupations are projected to shrink, with declines for Child and Family Social Workers (−3.6%) and Social Workers overall (−4.4%). Education faces even steeper challenges: fewer students are choosing teaching majors, leading to projected declines in Elementary and Middle School Teachers (−6.7%), Secondary School Teachers (−7.4%), and especially Special Education Teachers (−9.4%). These are alarming figures in light of nationwide teacher shortages.
Design-oriented roles such as Commercial and Industrial Designers (+13.9%) and Graphic Designers (+5.1%) are seeing modest growth, suggesting that creative fields with strong digital components are holding their own. In contrast, communications and media careers are in retreat. Editors (−5.6%), Writers and Authors (−7.6%), and Public Relations Specialists (−10.9%) are all projected to decline. The most dramatic drops are in journalism and broadcasting: News Analysts and Reporters (−20.1%) and Broadcast Announcers (−11.2%) face sharp declines, mirroring the broader contraction in traditional media industries.
In short, the shifting interests of college students are likely to amplify existing trends in the labor market—fueling growth in tech and engineering, straining the supply of educators and social workers, and accelerating the decline of legacy media roles. Understanding these dynamics is essential for workforce planning, higher education strategy, and career guidance.
Conclusion
The changing distribution of college majors reflects students’ ability to respond thoughtfully to evolving labor market demands. Rising interest in fields like computer science, engineering, health sciences, and biomedical research shows that today’s students are making strategic choices aligned with areas of strong economic growth and societal need.
At the same time, the sharp declines in humanities, education, social work, and certain service professions raise important concerns. As fewer students prepare for careers in teaching, caregiving, and civic leadership, critical sectors risk facing future shortages. Moreover, the erosion of the humanities — disciplines that foster creativity, critical thinking, ethical reasoning, and cultural understanding — could leave society less equipped to navigate the human dimensions of an increasingly automated, AI-driven world.
Recognizing both the strengths and vulnerabilities in these educational trends will be crucial. Supporting strategic, career-focused education while also maintaining robust pipelines into essential human-centered professions will help ensure that future labor market needs are met — not just in terms of technical skill, but in terms of social resilience, innovation, and democratic vitality.
Appendix A. Methodology
Data and sample. We use the public‐use microdata from the American Community Survey (ACS) one-year files for 2018 and 2023. The universe is U.S.-born adults who have completed at least a bachelor’s degree. Two age bands anchor the analysis: 22-24-year-olds represent the pipeline of recent graduates whose major choices we track, while 30-32-year-olds serve as an early-career reference group for establishing how majors map into jobs.
Building the major-to-occupation cross-walk. Using the 2023 ACS data for employed graduates aged 30-32, we compute, for every undergraduate major, the share of holders working in each Standard Occupational Classification (SOC) code. See example in the chart below. The resulting 2023 matrix captures the “typical” occupational outcomes of each field of study and is locked in as our cross-walk.

Projecting occupational mixes. We start with the actual mix of undergraduate majors for 22- to 24-year-olds in 2018 and again in 2023. Next, we apply a fixed 2023 major-to-occupation cross-walk—built from employed 30- to 32-year-olds—to each major mix. This effectively asks:
If the 2018 cohort of 22- to 24-year-olds followed today’s (2023) pathways from major to job, what would their occupational distribution look like when they themselves reach age 30-32?
If the 2023 cohort followed those same pathways, what would their age-30-32 distribution look like?
Because the cross-walk is held constant, the only difference between the two counterfactual workforces is the shift in student major preferences. Labor-market demand, demographics, and macro conditions are frozen in place, isolating the impact of changing majors alone.
Quantifying change. For every SOC occupation we compute the projected share derived from the 2018 majors and the share derived from the 2023 majors. We report both the percentage-point difference and the percentage change.

From Tech to Traditions: The Influence of Foreign-born workers on U.S. Jobs
From tech innovation to traditional trades, foreign-born workers are transforming the U.S. job market. This deep dive explores how diverse talents—from Indian software developers to Australian film directors—are driving industries, filling critical gaps, and reshaping America's workforce.
By Mariano Mamertino and Gad Levanon
Introduction
The diversity that foreign-born workers bring to the U.S. labor market is a tremendous asset, enriching the economy with a vast array of skills, perspectives, and expertise. Workers from different parts of the world often come with unique talents honed in their home countries, where traditions in specific industries, professions, or trades are deeply rooted. Whether it's software developers from India, acupuncturists from China, roofers from Mexico, cooks from Italy, floral designers from Japan, or film directors from Australia, these individuals contribute to the U.S. labor market by infusing it with specialized skills, knowledge, services, and products.
The wealth of experiences and knowledge they bring comes into full focus when we look at the types of occupations immigrants from different countries tend to cluster in when they make the U.S. their home. This cultural and professional diversity not only fills critical gaps but also supports a range of industries and sectors that make American cities stand out for the blend of diverse services, experiences, and goods they offer—not to mention the delicious melting pot of cuisines. Using a data-driven approach, we want to highlight the roles that make all this possible.
Sources and methodology
To identify the jobs foreign-born workers are more likely to do, we used the Census’s American Community Survey (ACS), which asks respondents about their employment status, occupation, and birthplace, among many other topics.
We analyzed data on all workers in the U.S., focusing on their countries of birth. This enabled us to calculate the foreign-born occupation quotient, the key metric in this article, which represents the ratio of workers born in each country who work in a specific occupation compared with the share of U.S.-born workers in the same occupation. A higher quotient indicates that foreign-born workers are more likely to be employed in that occupation relative to their U.S.-born counterparts.
Foreign-born workers find themselves in a range of occupations that are often, albeit not always, overlooked by American-born people. Let’s take a closer look.
Delicious food and a buzzing restaurant scene
Asian-born chefs and cooks are the undisputed champions of the U.S.'s vibrant food scene. Let’s start with Chinese cuisine, a staple of global culinary culture. Its presence in the U.S. is bolstered by Chinese immigrants working as chefs, head cooks, and food service workers. Compared with the average U.S.-born worker, Chinese-born ones are nine times more likely to work as chefs and head cooks.
Similarly, immigrants hailing from Thailand and Indonesia are between ten and eleven times more likely than U.S.-born folks to be employed as chefs, highlighting the influence of Southeast Asian cuisine on the U.S. culinary arts. Japan and Korea come next. Workers from those countries are about four and five times more likely than the average American to make the preparation of delicious food their main activity.
A relatively small country that has an outsized influence on the U.S. food scene is Greece. The famous Greek food and hospitality can be experienced in countless Greek diners and restaurants across the country, also thanks to the fact that Greek-born workers are almost seven times more likely than U.S.-born ones to work as food service managers. Talking of small countries with an outsized influence on hospitality, the Irish pub is probably as much of a U.S. institution as the local pizza parlor or bowling alley, and so are their friendly bartenders. It should not come as a surprise then that bartender is the job Irish-born workers are four times more likely to hold compared with U.S.-born people.
But the list would not be complete without two other mainstays of the American food scene: Italian and Mexican food. The quotients for chefs and cooks born in either Mexico or Italy are in fact between 3.5 and 4.5, meaning they are roughly four times more likely than American-born workers to work as chefs.
Figure 1. Who is most likely to work as a cook or head chef? Occupation quotient of foreign-born Cooks and Head Chefs, by country of birth. (Source: ACS.)
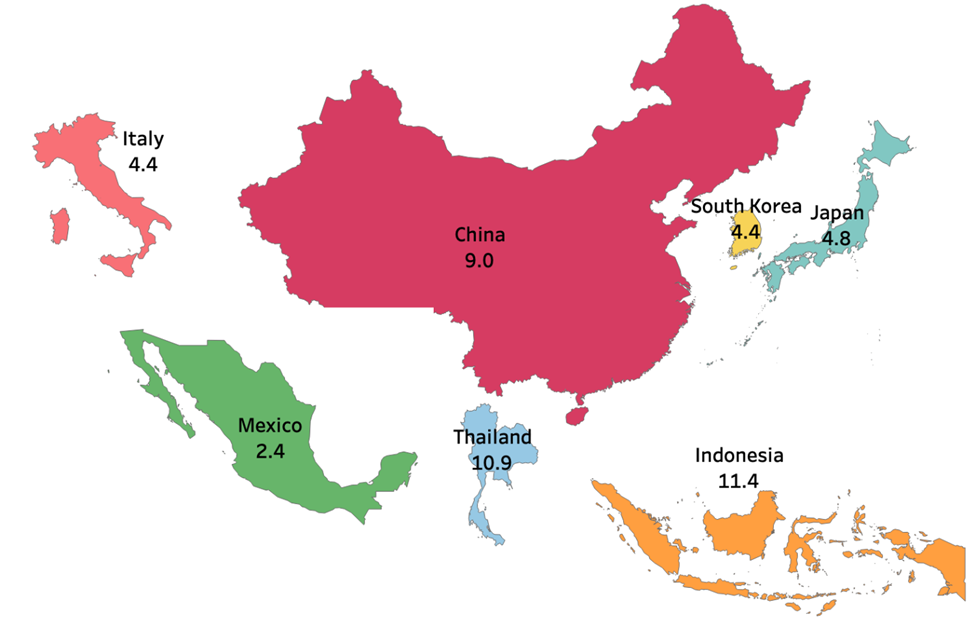
Figure 2. In which other food-related occupations are foreign-born workers more likely to be employed? Occupation quotient of foreign-born workers in selected food-related occupations, by country of birth. (Source: ACS.)
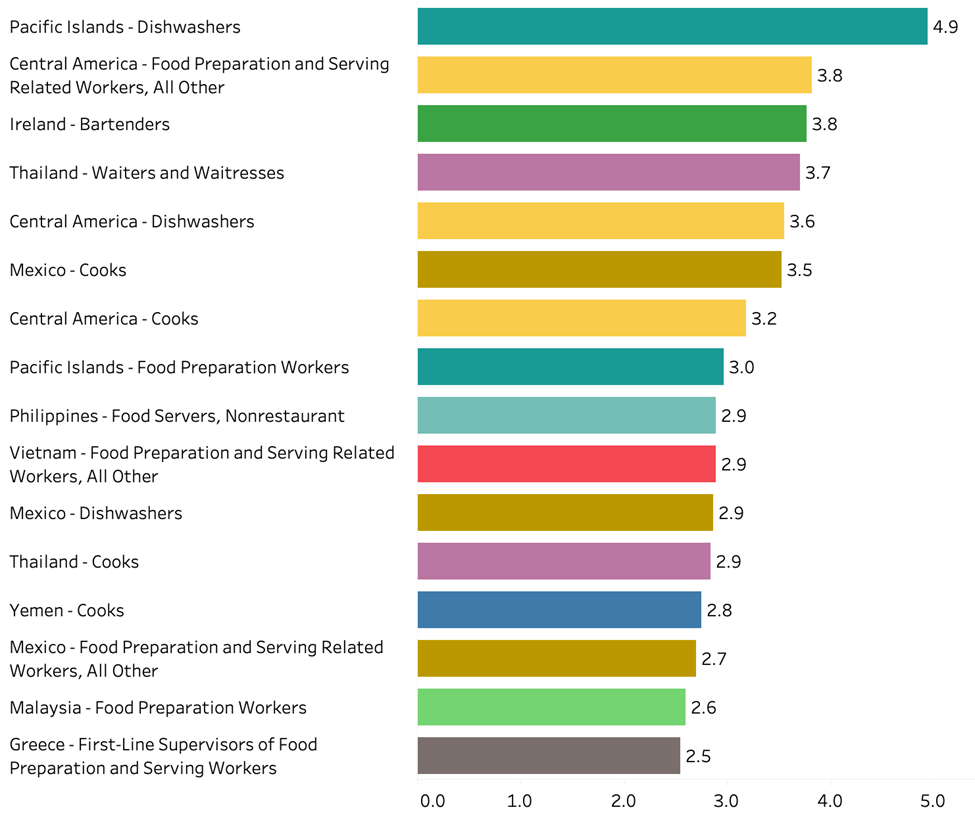
The creative scene: Design, arts, fashion, and music
Few things bring more joy, amusement, and fascination than the products of artistic and creative endeavors. Again, this is an area where foreign-born workers are particularly active. Korean immigrants have made a mark on the U.S. fashion industry. For example, they are eight and a half times more likely than U.S.-born workers to work as fashion designers. This notable figure underscores the global impact of Korea’s dynamic fashion culture, supported by the export of K-pop music and its global style icons.
Turning to Japan, we see a strong contribution in a unique profession: the realm of floral design. Japanese-born workers, deeply rooted in the aesthetic traditions of practices like Ikebana, are more than three times more likely to be employed in this field than their U.S.-born counterparts. Their ability to blend natural beauty with artistic finesse has made them highly sought-after in the American floral industry. Furthermore, Japanese immigrants also excel in the broader arts sector, displaying a similarly high quotient in roles such as artists, musicians, and singers.
Meanwhile, Australians and New Zealanders bring their creative prowess to the U.S., particularly in photography, film direction, and graphic design. Workers born in the two countries are six times more likely to work as producers and directors than the average U.S.-born worker. They are also between two-and-a-half to three times more likely to work as graphic designers and photographers.
Italian immigrants are another group deeply involved in the cultural arts. Notably, they are four times more likely than their U.S.-born counterparts to work as music directors. They may have an advantage since several world-famous operas are sung in Italian.
Figure 3. In which creative occupations are foreign-born workers more likely to be employed? Occupation quotient of foreign-born workers in selected creative occupations, by country of birth. (Source: ACS.)

Taking care of others
Perhaps the industry where the presence of foreign-born workers is most consequential is healthcare and caregiving. Filipino immigrants are indispensable in the U.S. healthcare system in a way that few other groups are, filling a wide range of crucial roles across various medical professions. Their presence is particularly significant in nursing, with Filipino-born workers being five times more likely than U.S.-born ones to work as registered nurses. Workers born in Iran, India, and other parts of the Middle East also hold key roles in the U.S. healthcare sector, particularly in high-skill positions such as physicians and surgeons. Iranian-born doctors stand out, being six times more likely to work as physicians and four times more likely to work as surgeons than U.S.-born people. Those hailing from Syria are fourteen times more likely to work as physicians than the average U.S. worker. The quotient for Indian-born professionals is 6.5.
Beyond healthcare, workers born in foreign countries still contribute to the mental, spiritual, and physical well-being of Americans. Chinese immigrants, for instance, are pivotal in bringing traditional holistic health practices to the U.S., particularly acupuncture and massage therapy. A Chinese-born person is eighteen times more likely than a U.S.-born one to work as an acupuncturist, one of the highest quotients in our analysis. Chinese practitioners are leading the charge in meeting the growing American demand for alternative health treatments.
Additionally, Vietnamese-born workers have established a dominant presence in nail care within the personal care industry. Workers born in Vietnam are 355 times more likely to work as manicurists and pedicurists than U.S.-born people. This is the highest quotient in the entire dataset. Their expertise extends to roles as hairstylists and cosmetologists, albeit with a much smaller quotient of 3.3, demonstrating their contribution to beauty and personal care.
Thai-born workers also make a significant contribution to the physical well-being of others. They are nine times more likely than U.S. workers to work as massage therapists. Similarly, people born in the West Indies are the foreign-born group most likely to work as home health aides, with a remarkable quotient of 14.7, underscoring their importance in providing essential in-home care services.
Figure 4. In which health-related and personal services occupations are foreign-born workers more likely to be employed? Occupation quotient of foreign-born workers in selected health-related and personal services occupations, by country of birth. (Source: ACS.)

Driving innovation in tech and engineering
Another group of professions where foreign-born workers have had a transformative impact is in tech and engineering roles. Let’s begin with the country most prominently represented in this field: India. Indian immigrants have become closely associated with leadership in tech, holding pivotal roles in U.S. technology and engineering. Their presence is particularly pronounced in software development, where Indian-born workers are an astounding 17.5 times more likely than U.S.-born workers to hold such roles. In computer hardware engineering, the quotient is similarly impressive at 14, underscoring the critical contribution of Indian talent to maintaining the U.S. technological edge. The influence of Indian professionals extends to electrical and electronics engineering, where they are five times more likely to be employed, reflecting the rigorous training provided by Indian educational systems, which prepares engineers to tackle complex challenges in innovation and infrastructure development.
Chinese-born workers also have a profound impact on the U.S. tech and engineering landscape. They are notably present in fields like computer hardware engineering, where their quotient stands at 7.6, and in chemical engineering at 3.6. Moreover, Chinese talent is well-represented in computer and information research, with a quotient of 4.0, illustrating their pivotal role in advancing cutting-edge technologies and contributing to the U.S.'s leadership in tech innovation.
Nepalese, Russian, Malaysian, and Turkish immigrants, though fewer in number, also make significant contributions: they are between five and six times more likely than U.S.-born workers to be employed as software developers. Iranian-born professionals, alongside Malaysian-born workers, play a crucial role in the engineering sector. In particular, they are employed in electrical and electronics engineering roles at six times the rate of U.S.-born workers.
Figure 5. Who is most likely to work as a Software Developer? Occupation quotient of foreign-born Software Developers, by country of birth. (Source: ACS.)

Figure 6. What other tech occupations are foreign-born workers more likely to work in Foreign-born occupation quotient for selected tech occupations by country of birth. (Source: ACS.)

Growing, building, and fixing things
The agriculture, construction, and skilled trades sectors in the U.S. are also heavily supported by the contributions of foreign-born workers, whose expertise is vital to these industries. These are the people who grow our crops, build, and fix our houses. Mexican immigrants are particularly prevalent in agricultural roles, where they excel as graders and sorters of agricultural products. They are nineteen times more likely than U.S.-born people to work in such roles. Their significant presence in this area ensures that the U.S. food industry maintains high standards in production and distribution, making them indispensable in the agricultural supply chain.
The Mexican-born often occupy specialized positions in construction, such as plasterers, drywall installers, and roofers. They are between ten and seventeen times more likely to work in these jobs than the average U.S.-born worker. Beyond agriculture and construction, Mexican immigrants are also vital in other skilled trades, such as pressers and upholsterers, with quotients ranging from 5 to 8. Mexican-born, alongside Central American-born people are also between three and four times more likely than natives to work as pipelayers. While Mexicans are also more likely to work as plumbers, Cuban and Albanian-born workers are the group most likely to work as electricians, with quotients ranging between two and three.
Figure 7. Occupations in which Mexican-born workers are most likely to be employed. Top occupation quotients for Mexican-born workers. (Source: ACS.)

Conclusions
In conclusion, the diverse contributions of immigrants across key professions and roles in the United States—from technology and engineering to healthcare, hospitality, and skilled trades—are undeniable. These foreign-born workers not only fill essential roles but also bring a wealth of expertise and cultural richness that enhances the fabric of the American workforce.

Is Productivity Accelerating? Some Initial Thoughts
After a decade of sluggish productivity growth, the U.S. is now witnessing an unprecedented surge. Could this be the start of a new economic era fueled by tech, AI, and creative destruction? With labor shortages and digital transformation driving the boom, is this productivity spike sustainable—or will it further widen economic divides across the country?
By Gad Levanon
Introduction
The decade preceding the pandemic was marked by the lowest productivity growth ever recorded in the U.S., raising serious concerns about the nation's long-term economic prospects. However, the recent surge in productivity over the past 5 years, particularly in the last 4-5 quarters, potentially signifies a reversal and suggests a positive shift that appears to be unique to the U.S. among major advanced economies. Is the acceleration in labor productivity growth sustainable? Very few economic related questions are more important. While it is too early to reach definite conclusions, below are some early thoughts.
This resurgence is primarily driven by a significant increase in capital investments, especially in software and research and development. Additional key factors contributing to this acceleration include the transformative impact of digitalization and creative destruction, which has reallocated resources to more efficient businesses. Furthermore, the expansion of West Coast technology companies into various sectors has disrupted traditional business practices and driven productivity improvements across the board. Labor shortages have also played a role, as companies have increasingly turned to automation and optimized workforce strategies to maintain output. The introduction and integration of Generative AI into various industries may have further boosted productivity.
These dynamics, largely catalyzed by the pandemic, are expected to support strong productivity growth in the near term. While this growth may not reach the heights seen in the late 1990s and early 2000s, it is poised to significantly outpace the sluggish growth observed in the 2010s. Beyond the near term, the rate of productivity growth will largely depend on the transformative potential of generative AI. Although there is limited data to rely on, I am cautiously optimistic about its potential to sustain longer-term gains.
This resurgence in productivity has the potential to substantially improve living standards and reduce inflation. However, it could also widen economic disparities across the country.
Recent Productivity Trends
In the past 4-5 quarters, labor productivity has been rapidly improving. From a business cycle perspective, this is happening at a time when one wouldn’t expect unusually strong growth in labor productivity.
Historically, labor productivity growth is strong in the 1-2 years following a recession. However, in the past 4-5 quarters, we've observed strong productivity growth occurring 3-4 years after the pandemic recession. This atypical timing suggests that there may be factors at play beyond the usual cyclical fluctuations in productivity. The data in the chart are likely to be revised up for 2023-2024 due to the expected revisions to the jobs data.

As shown in the chart above, productivity tends to be highly volatile when viewed on a 4-quarter basis. To gain a clearer understanding of productivity trends, it's more effective to analyze data over longer periods.
Notably, the five-year percent change in productivity is now much higher than in the previous five years. While this is a positive sign, it's important to consider that the comparison spans a period disrupted by the pandemic, making it less straightforward to draw direct parallels.
It is interesting though that when using OECD data, we see that the boost in productivity growth in 2018-2023 versus 2013-2018 was unique to the US. In most other advanced economies, the productivity growth in 2018-2023 was abysmal. The U.S. comparative advantage in technology, has likely played an important role in the unique boost in productivity seen from 2018 to 2023.

Source: OECD
Productivity growth in the U.S. shows significant variation across sectors. As illustrated in the chart below, the manufacturing sector has experienced a plateau in productivity over the past decade, with a slight decline in some instances. It appears that the most straightforward gains from substituting technology for labor in manufacturing were largely realized by 2010.
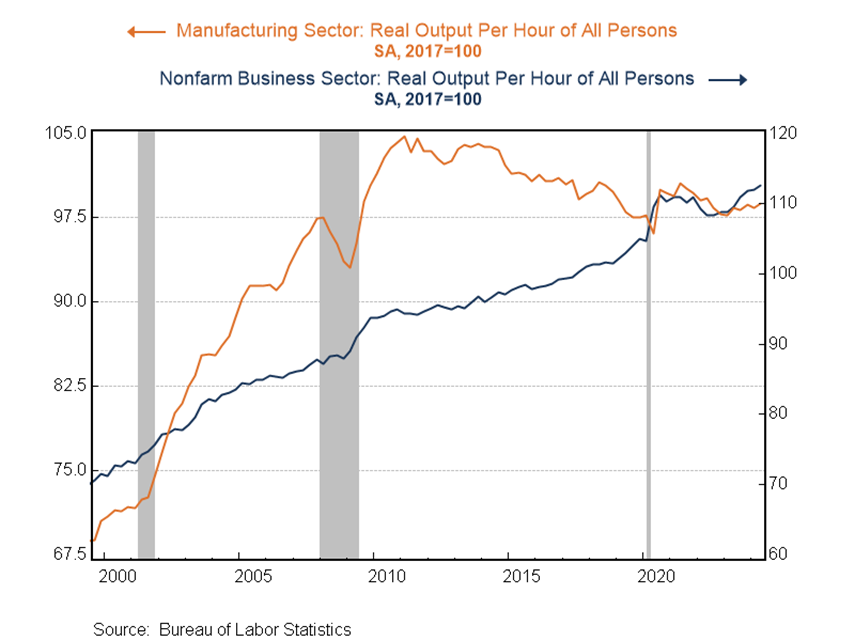
To better understand the recent growth in labor productivity we need a few definitions:
1. Labor Productivity: Labor productivity measures the amount of goods and services produced per hour of labor. Labor productivity growth is a sum of three factors below:
2. Contribution of Capital Intensity: Capital intensity refers to the amount of capital (e.g., machinery, equipment, software, knowledge from R&D) used per unit of labor. The contribution of capital intensity to labor productivity measures how much of the productivity growth is due to increases in the amount or quality of capital per worker.
3. Contribution of Labor Composition: Labor composition refers to the quality or skill level of the workforce, which can include factors such as education.
4. Total Factor Productivity (TFP): Total Factor Productivity (TFP) represents the portion of output not explained by the amount of inputs used in production (i.e., labor and capital). It captures the efficiency with which labor and capital are used together in the production process. TFP is often seen as a measure of innovation, technological improvements, organizational changes, and other factors that lead to more efficient production processes.
Breaking down the acceleration in labor productivity growth between 2013-2018 and 2018-2023 (look at the green bar), we find that it came mostly from the larger contribution from capital intensity.

Source: Bureau of Labor Statistics
The growing contribution of capital intensity to GDP is increasingly driven not by traditional investments in equipment and structures but by significant investments in software and research and development (R&D). Since the late 2010s, and particularly following the onset of the pandemic, the impact of these investments has surged. This shift was fueled by the widespread move to remote work, education, and services, necessitating extensive digital transformation across organizations. Additionally, the rapid advancement and implementation of artificial intelligence (AI) have further accelerated this trend.

However, despite these substantial investments, total factor productivity (TFP), the efficiency with which labor and capital are used, has not yet shown a corresponding acceleration, remaining modest by historical standards. There is hope that like the productivity surge observed during the 1995-2005 period following large-scale capital investments, these recent investments will eventually lead to stronger gains in TFP.

What other factors may have contributed to the acceleration in productivity growth?
More creative destruction: The simultaneous surge in Private Sector Gross Job Gains at Opening Establishments and Gross Job Losses at Closing Establishments since the onset of the pandemic likely played a significant role in boosting U.S. labor productivity. This period saw a marked increase in creative destruction, as resources were reallocated from less efficient businesses to more productive ones, fueled by heightened entrepreneurial activity. However, it's worth noting that Job Gains at Opening Establishments have trended downward slightly over the past year, which may suggest a lower contribution to productivity growth moving forward.

Expansion of west coast tech companies: West Coast tech companies are more efficient and productive than many U.S. firms. In recent years, they've expanded into sectors like finance, healthcare, retail, automotive, education, entertainment, agriculture, and logistics. This expansion has disrupted traditional practices, raising productivity across these industries. Their soaring market capitalization reflects strong investor confidence in their continued influence and growth. As these companies keep innovating and investing in emerging technologies they are poised to drive further productivity gains.
Labor Shortages: During the labor shortages of 2018-2019 and 2021-2023, companies accelerated productivity growth by investing in automation and advanced technologies, reducing their reliance on scarce labor. These shortages also led firms to optimize workforce utilization and innovate business processes, shifting towards more capital-intensive operations. This transition resulted in higher output with fewer workers, driving significant productivity gains.
Generative AI: Since late 2022, the evolution of generative AI appears to have had some positive impact on labor productivity in various sectors. By automating tasks such as content generation, coding, data analysis, and customer support, AI has likely enabled workers to shift focus to higher-value activities. In industries like marketing, software development, and finance, AI tools seem to have accelerated certain workflows, potentially leading to quicker decision-making and improved output. These are still early days though, and we can’t quantify the magnitude of the impact of generative AI
In sum, here are the key factors that may have impacted faster productivity growth in recent years:
· Increased Capital Intensity - Increased investment in software and R&D.
· Digital Transformation – including shift to remote work and services.
· Creative Destruction - Reallocation of resources to more efficient businesses.
· West Coast Tech Expansion - Disruption and efficiency across various sectors.
· Labor Shortages - Automation and workforce optimization
· Generative AI - Automation of tasks and improved decision-making.
Most of these factors were triggered by the pandemic economy and are likely to have a stronger impact in the near term than in the longer term. Therefore, I anticipate relatively strong productivity growth over the next 2-3 years. Beyond the near term, generative AI is expected to become the primary driver of productivity. While there is limited precedent to rely on, I am cautiously optimistic about its potential to sustain longer-term gains. While I don't expect productivity growth to return to the golden days of 1995-2005, I do believe it will significantly outpace the slower growth seen in the 2010s.
Implications:
If labor productivity were to grow rapidly in the coming years, it could have several significant implications for the U.S. economy and labor market:
Increased productivity could reduce the need for additional workers if productivity outpaces demand growth, potentially loosening the labor market. In the current demographic environment, rapid productivity growth can counterbalance the effects of a slow-growing or even shrinking labor force.
Productivity growth can lower unit labor costs, as businesses produce more with the same or fewer labor inputs, helping increase profitability. Stronger productivity growth could also lower inflation control inflation by reducing the need for businesses to raise prices to cover labor costs.
Periods of strong productivity growth could lead to growing income and wealth inequality, as business owners and senior executives benefit more than workers. In addition, economic benefits could be uneven across regions, with areas with higher tech concentration experiencing more growth.
But most of all, labor productivity is the main determinant of living standards. By increasing the efficiency with which goods and services are produced, it allows economies to generate more wealth from the same amount of resources, directly boosting the quality of life.


The Midwest is in a Vicious Cycle
As the 2024 elections loom, Labor Matters dives into the Midwest’s vicious cycle of economic decay and educational disengagement, fueling a political shift that could reshape the nation. With the region spiraling towards the GOP and higher education in freefall, could the Midwest’s decline signal a deeper fracture in America’s future?
By Gad Levanon
As the 2024 elections approach, this edition of Labor Matters will examine the political implications of labor market and higher education trends, and how these trends, in turn, influence politics. Nowhere are these issues more prominently highlighted than in the Midwest.
The Midwest finds itself amid a vicious cycle of economic, demographic and educational decline that is reshaping its societal and political landscape. Historically a manufacturing stronghold, the region has suffered significant job and population losses, and economic stagnation. At the same time, the Midwest is barely benefiting from the rise of tech and consulting, that are boosting growth in other parts of the country.
Amidst these challenges, there has been a notable political shift, with the Midwest increasingly gravitating towards the Republican Party. This political realignment corresponds with a growing skepticism among Republicans about the value of higher education. This skepticism is manifesting tangibly as a stagnation in 4-year college enrollment rates across the Midwest.
The cycle of economic decline and educational disengagement is likely to perpetuate itself, potentially leading to even more significant declines in the coming years.
Economic and population decline
The economic trajectory of the Midwest over the past few decades has been significantly shaped by two major factors: the decline of the manufacturing sector and the minimal impact from the booming tech and consulting industries.
Historically, the Midwest relied heavily on manufacturing. However, this sector has experienced a significant decline in employment due to a combination of offshoring, migration to the Sun Belt, and automation. These changes have led to widespread job losses and reduced economic activity, contributing to a broader economic downturn in the region.
In contrast, the expansion of the U.S. economy over the past decade has been significantly driven by two key sectors: Professional & Technical Services and Information, representing the technology and consulting industries. The accompanying chart illustrates the importance of these sectors to state GDPs, showing that they play a substantial role in the economies of the Pacific region and states near New York City, Boston, and Washington D.C.
However, many states in the South and Midwest see minimal impact from these industries. Consequently, the populations in these regions largely miss out on the rapid growth observed in the tech and consulting sectors.

Recent economic data starkly reflects these trends. Among U.S. regions, the Midwest, particularly the Great Lakes states, has experienced the most significant drop in per capita income relative to the national average over recent decades. As a result, nearly every state in the Midwest now falls below the average state income.

This trend is evident in the distribution of fast-growing metropolitan areas in the U.S., where the Midwest is notably underrepresented. For instance, between 2012 and 2022, only three out of 72 metropolitan areas identified as top performers in personal income and per capita income growth were in the Midwest.
In recent years, this slower growth in Midwestern states has persisted:

In addition to declining per capita income, Midwestern states have also been among the slowest growing in terms of population. Even if an individual's financial situation remains stable, living in an area with a shrinking population can negatively impact their sense of well-being. Reduced social interactions, fewer local services, and economic stagnation contribute to feelings of isolation and insecurity. Moreover, the visible deterioration of the community and a decline in cultural activities can adversely affect mental health and overall quality of life.
Impact on voting
This economic and population decline has also had significant political ramifications. Our analysis indicates a substantial political shift in the Midwest between the 2012 and 2020 presidential elections, with no other region in the country moving more decisively towards the Republican Party. Over the past decade, the Republican Party's message has increasingly resonated with those who feel economically left behind—a sentiment that has grown strong and relatively new in the Midwest.

The Midwest's shift towards the Republican Party is part of a broader trend where regions with lower levels of education and income increasingly align with Republican candidates. The chart below presents findings from a recent analysis that examines the relationship between the Republican-Democrat vote share gap and key demographic indicators: personal income per capita and the population share with a bachelor’s degree. This analysis utilized data from the 2000 largest counties in the United States, covering presidential election results from 2000 to 2020.
In 2000, the analysis revealed a barely negative correlation between the vote share gap and both personal income per capita and the share of the population with a bachelor’s degree, indicating that voting preferences were not significantly polarized by these demographic factors at the turn of the millennium.
However, over the next 20 years, these correlations turned markedly negative, particularly in relation to the population share holding a bachelor’s degree or higher. This shift suggests a substantial change in how educational attainment influences voting behavior, with lower education levels increasingly aligning with the Republicans.
The evolution of these correlations, especially the pronounced negative shift with education levels by 2020, indicates a growing political divide based on socioeconomic status, particularly education. If this trend continues through 2024, areas with lower education attainment and personal income, like the Midwest, are likely to shift further towards Republicans.

And there are also higher education implications. A recent Gallup study https://news.gallup.com/poll/646880/confidence-higher-education-closely-divided.aspx) reveals a significant decline in public confidence in higher education, particularly among Republicans. According to the study, 50% of Republicans now express very little or no confidence in higher education institutions, marking a substantial increase from six to nine years ago.

The declining confidence among Republicans is likely leading to reduction in their enrollment in colleges and universities. Our earlier analyses indicate that, all else being equal, colleges in counties that shifted towards the GOP between 2012 and 2020 saw significant declines in student numbers.
And when looking at actual enrollment data, while in other regions, the share of 18-24 y.o enrolling in 4-year colleges has been growing in the past decade, in the Midwest it has been stagnating.

The Midwest contends with simultaneous declines in educational attainment, population and economic development. This region is caught in a self-perpetuating cycle of economic downturn and educational disengagement, which may lead to more pronounced declines in the future. The widening economic divide threatens the Midwest's competitiveness and viability in a rapidly changing national landscape. This trend, if unaddressed, suggests that today's challenges could merely be the beginning of a more severe deterioration.
Without significant intervention, such as a comprehensive development plan akin to the Marshall Plan, the Midwest risks further economic degradation and a deepening distrust in fundamental American institutions and democratic values