
The Long Game: How College Rankings Change Over the Career Lifecycle
By Gad Levanon, Joseph Winkelmann and Mels de Zeeuw
Introduction
Understanding the long-term economic value of a college education is a central concern for students, families, and policymakers. One popular approach to measuring this is through alumni earnings. These rankings typically rely on earnings measured just a few years after graduation.
The focus on early years can be especially damaging for liberal arts colleges (LACs). LAC graduates generally earn less than their peers, in part because they are more likely to enter lower-paying but socially valuable fields such as education, the arts, and nonprofit work. Especially after adjusting for student selectivity—using metrics like average SAT scores—graduates from LACs appear to dramatically underperform in early-career earnings. This depresses their position in school rankings and may reduce their appeal to prospective students.
However, much of this underperformance is concentrated in the early years after graduation. Over time, LAC graduates tend to catch up—narrowing or even closing the earnings gap with peers from other institutions. This report investigates how the earnings of different college types evolves from early to mid-career, with a particular focus on liberal arts colleges.
Using the Burning Glass Institute’s comprehensive labor market database, which contains career histories of over 65 million Americans and spanning multiple decades of graduates, we examine both the extent of this earnings catch-up and the factors that may drive it—including occupational mobility, graduate school enrollment, family background, and the long-term benefits of generalist skills.
By tracing these lifecycle dynamics, we aim to inform more nuanced college rankings and contribute to a deeper understanding of what makes a college education truly “valuable” over the course of a career.
Definition, sample and data
Our college sample includes all liberal arts colleges, public research universities, and private research universities in the US. We exclude other types of higher education institutions such as community colleges, for-profits, or professions-focused schools, as these institutions tend to attract different types of students. The institutions in our sample account for around 75% of bachelor’s degrees awarded in the US every year.
Among public and private research universities, we further distinguish high-STEM schools as schools with high shares of certain majors in their distribution of awarded degrees between 2010-2023.[1] We divide 562 schools into the following groups:
1. Liberal arts colleges (N=158)
2. High-STEM research universities (N=80)
3. Other public research universities (N=169)
4. Other private research universities (N=155)
Figure 1 shows how liberal arts colleges and STEM schools differ meaningfully in the programs they focus on and thereby also in the careers they prepare their students for. The figure shows the shares of awarded bachelor’s degrees by school type for distinct degree types. Liberal arts schools stand out as awarding noticeably low shares of business and other professional degrees. Instead, liberal arts schools award a comparatively high share of social science and humanities degrees.

__________________________________________________________________________________________________
Services (11), Engineering (14), Engineering Technologies/Technicians (15), Military Technologies (29), Science Technologies/Technicians (41)
These differences in specializations may contribute to differences in average earnings trajectories between colleges. In our main results below, we measure earnings differences between graduates of different colleges conditional on college major, in addition to demographic controls. Conceptually, we are interested in whether students who major in the same field will expect different earnings trajectories depending on the type of college they attend. We consider some potential reasons for such differences in our analysis and discussion below.
Our earnings measures are based on students who graduated with a bachelor’s degree between 1988 and 2023. We observe earnings outcomes between calendar years 2008 and 2024. Our main object of interest is the average value-add of these four groups of schools at different experience levels, which we define as years since graduation.
It is important to account for differences in average SAT scores.
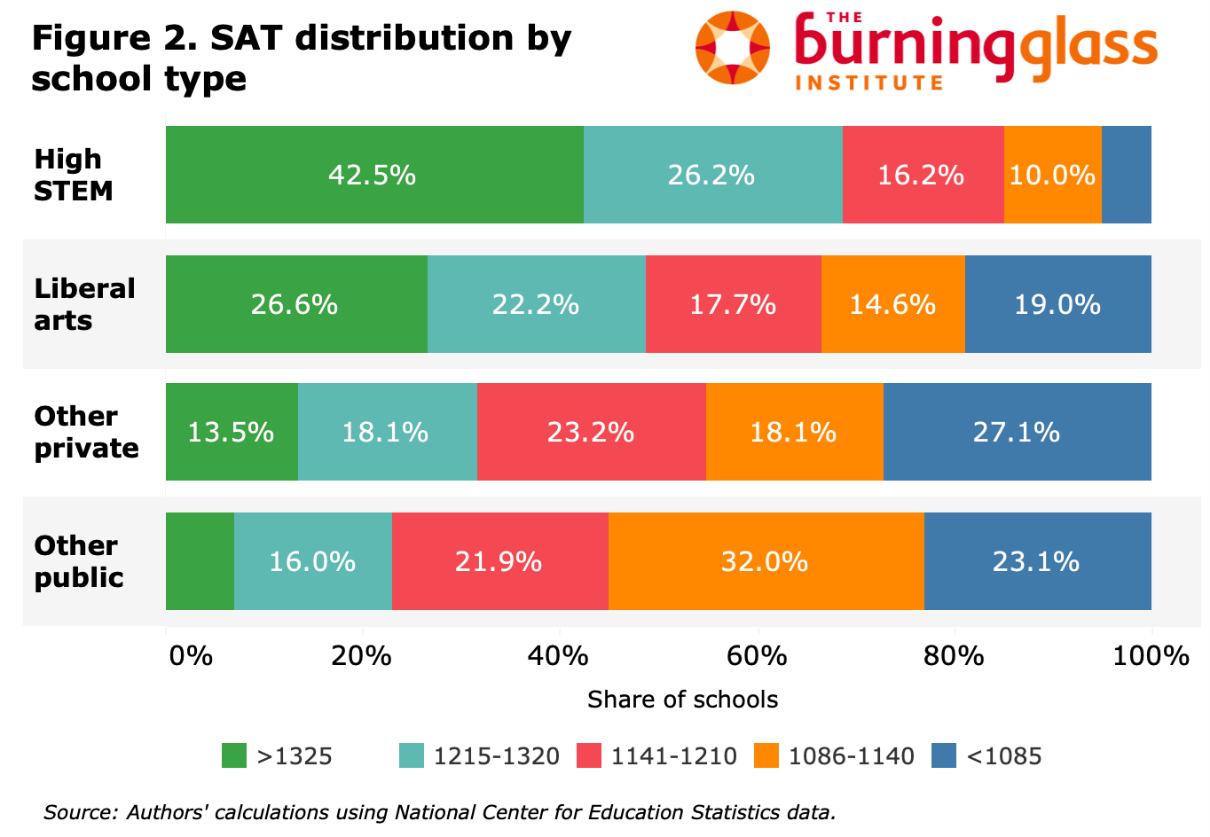
Before we get to the main results we need to account for differences in average SAT scores across colleges. Individual earnings depend on many factors, and there is differential selection of students across schools that limits the “value-add” interpretation when comparing raw graduate earnings. It is beyond the scope of our analysis to control for all such factors, but we do control for the average SAT score of admitted students. As Figure 2 shows, SAT scores vary significantly across school types—high-STEM schools are especially likely to admit high-scoring students. Therefore, we present results of our analysis also controlling for SAT to rule out that those differences are driving our findings.
Do Rankings Shift Over Time? Earnings Value-Add by Years Since Graduation
In order to understand differences in lifecycle earnings patterns across school types, we estimate value-add regressions separately by year since bachelor graduation. We regress log earnings on race, gender, degree major, cohort, and school fixed effects. We then average the school fixed effects within types of schools, both raw and controlling for the average SAT scores of admitted students. We exclude currently enrolled graduate students who may have artificially low earnings from part-time or similar jobs. Figure 3 shows the results from that analysis.

Liberal Arts Colleges Results
While this report focuses on changes over time, first-time Labor Matters readers may be surprised by how low the salary value-added is for graduates of liberal arts colleges (LACs). After controlling for SAT scores, LACs consistently rank lowest among the four groups across the entire career lifecycle.
One major reason is that LAC graduates are far more likely to pursue social-impact occupations—roles in fields like education, social services and non-for-profits that contribute to the public good but tend to pay less than other jobs requiring similar levels of education. These positions are vital to society yet remain undervalued in the labor market.
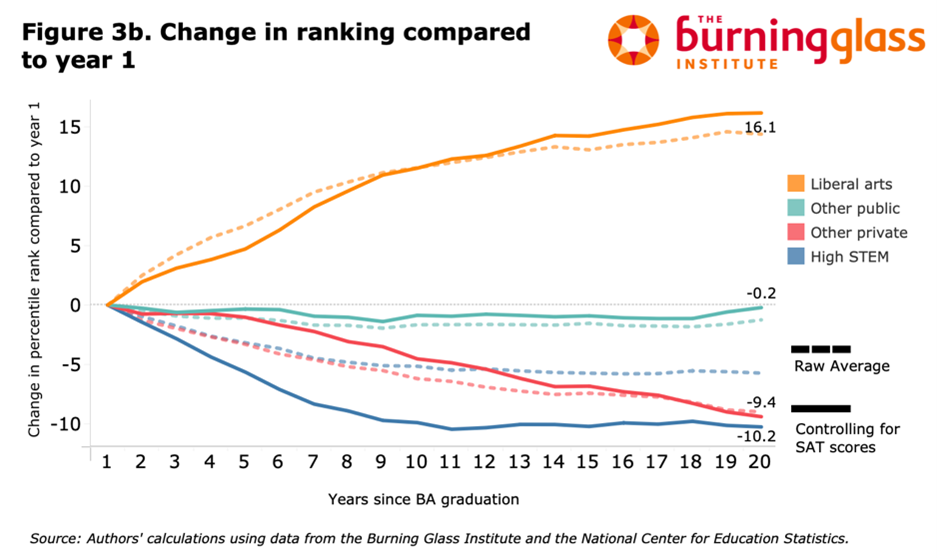
Turning to the over-time analysis, the blue line in Figure 3A shows that liberal arts graduates gradually catch up to the average graduate over time. This pattern is even clearer in Figure 3B, which tracks changes in the average percentile rank by school type relative to the first year after graduation.
As Figure 3 illustrates, graduates of liberal arts colleges gain roughly 15 percentile ranks between the first year after graduation and 15–20 years later. In the left-hand chart (without controlling for SAT), LACs start with the lowest value-add among the four groups but, by year 15, trail only the high-STEM group.
By contrast, graduates of high-STEM schools and private research universities look especially strong in the early years after graduation but lose some ground over time—even though they continue to earn the highest salaries on average. In general, the type of college one goes to matters much more at the beginning of one’s career than in the middle of it.
While Figure 3 compares general patterns between the different types of schools, Figure 4 shows the school-specific trends underlying these broad patterns for a select group of liberal arts colleges. These examples highlight how liberal arts colleges tend to significantly improve their value-add ranking over time, especially within the first decade or so after graduation.

What Could Be Driving the Earnings Catch-Up for Liberal Arts College Graduates?
We find that graduates of liberal arts colleges tend to earn less early in their careers but gradually catch up to peers from other institutions. What might explain this trajectory?
Our regressions already control for race, gender, and undergraduate major at the individual level, as well as average SAT scores by institution as a proxy for academic selectivity. Yet the narrowing wage gap over time suggests additional dynamics are at play.
1. Family Income and Wealth
Liberal arts college (LAC) students tend to come from significantly wealthier families than students at other types of institutions (Figure 5). This can influence earnings trajectories in multiple ways, notably through strategic early-career choices: Higher family income allows LAC graduates to accept lower-paying but prestigious early jobs (e.g., in nonprofits, research, or policy), which may yield higher long-run returns.

2. Graduate School Enrollment
Partly because of higher family wealth, graduates of liberal arts colleges (LACs) are far more likely to pursue graduate or professional degrees—a key reason for their delayed earnings growth. As shown in Figure 6, LACs have significantly higher graduate school enrollment rates than other institutions.
Graduate education shapes earnings in several ways. First, advanced degrees—especially in law, business, and medicine—substantially raise earnings after completion.
Second, graduate school enrollment is not random. If high-ability students are more likely to continue their education, early-career data may understate the earnings potential of LAC graduates, since many of their strongest students are temporarily absent from the labor market. As these individuals re-enter the workforce, LACs appear to “catch up” over time.

Other Potential Explanations
Beyond graduate school and family background, several career-related factors may help explain the earnings catch-up observed among liberal arts college (LAC) graduates:
Occupational Transitions: Many LAC graduates start their careers in mission-driven or social-impact roles that pay relatively little. Over time, however, they often move into higher-paying sectors such as consulting, policy, philanthropy, or tech-enabled services—especially as financial pressures grow.
Upward Mobility Within Fields: Even those who remain in lower-paying sectors frequently advance into management or leadership roles (e.g., a teacher becoming a principal or a nonprofit officer rising to executive director), which bring substantial pay increases.
Sector Shifts Without Occupational Change: Some LAC graduates remain in similar occupations but move from nonprofit or public organizations to private-sector roles—such as from a nonprofit policy analyst to a consulting firm—where compensation is typically higher.
Generalist and Transferable Skills That Appreciate Over Time: Liberal arts colleges emphasize broad, transferable skills—such as communication, critical thinking, and interpersonal ability—that become more valuable as careers progress. Even within technical majors, LAC programs tend to stress generalist training over narrow specialization, which may lead to steeper earnings growth over the career lifecycle, consistent with the arguments of Deming and Noray (2020).
Conclusion
Our analysis shows that timing plays a critical role in measuring the value-added of different college types. Liberal arts college (LAC) graduates tend to earn less in the early years after graduation, leading to lower rankings in salary-based comparisons—especially when controlling for student selectivity.
However, these same graduates show substantial earnings catch-up over time, gaining as much as 15 percentile points in ranking by year 15. This lifecycle dynamic reflects several factors such as higher rates of graduate school enrollment, and occupational and sectoral shifts into higher-paying or leadership roles. It may also highlight the growing value of transferable skills developed in liberal arts settings.
In contrast, high-STEM schools deliver strong early returns that level off over time. These findings suggest that rankings based on short-term earnings can misrepresent long-term outcomes, particularly for institutions like LACs whose graduates follow delayed career trajectories.
[1] We define high-STEM schools as private or public research universities that fall in the top quintile of the share of bachelor’s degrees awarded in the following areas (CIP codes): Computer and Information Sciences and Support Services (11), Engineering (14), Engineering Technologies/Technicians (15), Military Technologies (29), Science Technologies/Technicians (41)
[2] With these cohorts and earning years our base analysis is not balanced, but the patterns described here hold true if we restrict to a single group of cohorts to control for potential cohort effects.